Vonage 2010 Annual Report Download - page 42
Download and view the complete annual report
Please find page 42 of the 2010 Vonage annual report below. You can navigate through the pages in the report by either clicking on the pages listed below, or by using the keyword search tool below to find specific information within the annual report.-
 1
1 -
2
-
3
-
4
-
5
-
6
-
7
-
8
-
9
-
10
-
11
-
12
-
13
-
14
-
15
-
16
-
17
-
18
-
19
-
20
-
21
-
22
-
23
-
24
-
25
-
26
-
27
-
28
-
29
-
30
-
31
-
 32
32 -
 33
33 -
 34
34 -
 35
35 -
 36
36 -
 37
37 -
 38
38 -
 39
39 -
 40
40 -
 41
41 -
 42
42 -
 43
43 -
 44
44 -
 45
45 -
 46
46 -
 47
47 -
 48
48 -
 49
49 -
 50
50 -
 51
51 -
 52
52 -
53
-
54
-
55
-
56
-
57
-
58
-
59
-
60
-
61
-
62
-
63
-
64
-
65
-
66
-
67
-
68
-
69
-
70
-
71
-
72
-
73
-
74
-
75
-
76
-
77
-
78
-
79
-
80
-
81
-
82
-
83
-
84
-
85
-
86
-
87
-
88
-
89
-
90
-
91
-
92
-
93
-
94
-
95
-
96
-
97
 |
 |

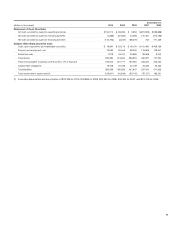
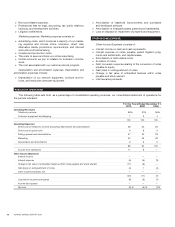
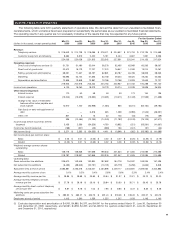
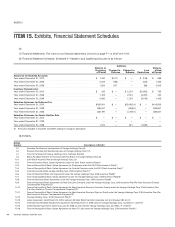
QUARTERLY RESULTS OF OPERATIONS
T
he following table sets forth quarterly statement of operations data. We derived this data from our unaudited consolidated finan
-
cial statements, which we believe have been prepared on substantiall
y
the same basis as our audited consolidated financial statements
.
T
he operating results in any quarter are not necessarily indicative of the results that may be expected for any future period
.
For the
Q
uarter Ende
d
(
dollars in thousands, except operatin
g
data
)
Mar 31
,
2
009
Jun 30
,
2009
S
e
p
30
,
2
009
Dec 31
,
2
009
Mar 31
,
2
0
1
0
J
un 30
,
20
1
0
S
e
p
30
,
2
0
1
0
Dec 31
,
2
0
1
0
R
evenue
:
T
elephon
y
services $ 215,643 $ 214,709 $ 216,085 $ 218,411 $ 224,527 $ 221,704 $ 212,135 $ 214,56
8
Customer equipment and shipping 8,362 5,319 5,420 5,131 3,424 3,637 1,991 3,056
224
,
005 220
,
028 221
,
505 223
,
542 227
,
951 225
,
341 214
,
126 217
,
62
4
O
perating expenses
:
D
irect cost of telephon
y
services (1) 51,751 51,480 52,044 58,278 62,495 62,969 60,263 58,06
7
D
irect cost of
g
oods sold 20,512 16,179 17,727 17,070 16,647 14,053 13,214 12,051
S
ellin
g
,
g
eneral and administrative 68,051 71,327 63,187 62,891 60,787 60,768 58,908 58,523
M
ar
k
et
i
ng 65,695 52,144 57,393 52,758 49,240 49,324 49,254 50,35
2
D
eprec
i
at
i
on an
d
amort
i
zat
i
on 12,896 13,848 12,881 13,766 13,768 13,929 12,649 12,72
7
218
,
905 204
,
978 203
,
232 204
,
763 202
,
937 201
,
043 194
,
288 191
,
720
I
ncome
f
rom operations 5,100 15,050 18,273 18,779 25,014 24,298 19,838 25,90
4
O
ther income (expense):
I
nterest
i
ncome 110 60 58 49 53 173 154 13
9
I
nterest ex
p
ense
(
13,542
)(
13,679
)(
13,690
)(
13,281
)(
13,211
)(
12,423
)(
11,569
)(
11,338
)
C
han
g
e in fair value of embedded
f
eatures within notes payable and
stock warrant 12,970 1,150
(
62,998
)(
1,055
)
835
(
8,241
)(
62,150
)(
29,782
)
Gain (loss) on early extinguishment of
d
ebt — — 3,816 225 1,038 (3,985) (1,545) (26,531)
O
ther, net 801 5 15 22 103 (43) (19) (59)
339 (12,464) (72,799) (14,040) (11,182) (24,519) (75,129) (67,571
)
I
ncome (loss) before income tax benefit
(expense) 5,439 2,586 (54,526) 4,739 13,832 (221) (55,291) (41,667)
I
ncome tax benefit
(
ex
p
ense
)(
168
)(
301
)(
29
)(
338
)
136
(
341
)(
91
)(
22
)
Net income
(
loss
)$
5,271
$
2,285
$(
54,555
)$
4,401
$
13,968
$(
562
)$ (
55,382
)$ (
41,689
)
Net income
(
loss
)p
er common share:
B
asic
$
0.03
$
0.01
$(
0.33
)$
0.02
$
0.07
$(
0.00
)$ (
0.26
)$ (
0.19
)
D
iluted
$(
0.03
)$
0.01
$(
0.33
)$
0.02
$
0.06
$(
0.00
)$ (
0.26
)$ (
0.19
)
W
ei
g
hted-avera
g
e common shares
o
utstandin
g
:
B
as
i
c 156
,
718 156
,
928 167
,
666 199
,
503 201
,
324 211
,
305 212
,
086 214
,
58
6
Dil
ute
d
218
,
787 218
,
997 167
,
666 203
,
376 221
,
947 211
,
305 212
,
086 214
,
58
6
O
perating Data
:
Gross subscriber line additions 226
,
610 143
,
645 190
,
834 187
,
592 154
,
718 154
,
997 163
,
055 167
,
435
Net subscriber line additions (6,493) (88,643) (50,191) (10,131) (25,779) (5,236) (4,846) 5,848
S
ubscriber lines at end of
p
eriod 2,583,861 2,495,218 2,445,027 2,434,896 2,409,117 2,403,881 2,399,035 2,404,883
A
vera
g
e monthly customer churn 3.1% 3.2% 3.4% 2.8% 2.6% 2.3% 2.4% 2.4
%
A
verage monthly revenue per line $ 28.86 $ 28.88 $ 29.89 $ 30.54 $ 31.37 $ 31.21 $ 29.72 $ 30.20
A
verage mont
hl
yte
l
ep
h
ony serv
i
ces
revenue per line $ 27.78 $ 28.18 $ 29.16 $ 29.84 $ 30.90 $ 30.71 $ 29.45 $ 29.78
A
vera
g
e monthly direct costs of telephony
services
p
er line
$
6.67
$
6.76
$
7.02
$
7.96
$
8.60
$
8.72
$
8.36
$
8.0
6
M
arketin
g
costs per
g
ross subscriber lin
e
a
dditions
$
289.90
$
363.01
$
300.75
$
281.24
$
318.26
$
318.23
$
302.07
$
300.73
E
mployees at end of period 1,413 1,260 1,239 1,225 1,207 1,158 1,145 1,140
(
1
)
Excludes de
p
reciation and amortization of
$
4,760,
$
4,880,
$
4,377, and
$
4,941 for the
q
uarters ended March 31, June 30, Se
p
tember 30
and December 31, 2009, respectivel
y
, and
$
4,981,
$
4,959,
$
4,357, and
$
4,428 for the quarters ended March 31, June 30, September 30
and December 31, 2010, respectivel
y.
3
5