Vonage 2010 Annual Report Download - page 30
Download and view the complete annual report
Please find page 30 of the 2010 Vonage annual report below. You can navigate through the pages in the report by either clicking on the pages listed below, or by using the keyword search tool below to find specific information within the annual report.-
 1
1 -
2
-
3
-
4
-
5
-
6
-
7
-
8
-
9
-
10
-
11
-
12
-
13
-
14
-
15
-
16
-
17
-
18
-
19
-
 20
20 -
 21
21 -
 22
22 -
 23
23 -
 24
24 -
 25
25 -
 26
26 -
 27
27 -
 28
28 -
 29
29 -
 30
30 -
 31
31 -
 32
32 -
 33
33 -
 34
34 -
 35
35 -
 36
36 -
 37
37 -
 38
38 -
 39
39 -
 40
40 -
41
-
42
-
43
-
44
-
45
-
46
-
47
-
48
-
49
-
50
-
51
-
52
-
53
-
54
-
55
-
56
-
57
-
58
-
59
-
60
-
61
-
62
-
63
-
64
-
65
-
66
-
67
-
68
-
69
-
70
-
71
-
72
-
73
-
74
-
75
-
76
-
77
-
78
-
79
-
80
-
81
-
82
-
83
-
84
-
85
-
86
-
87
-
88
-
89
-
90
-
91
-
92
-
93
-
94
-
95
-
96
-
97
 |
 |
S
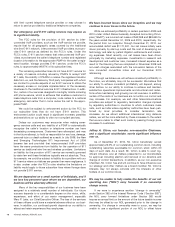
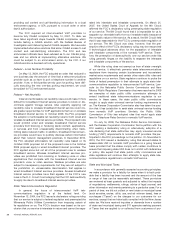
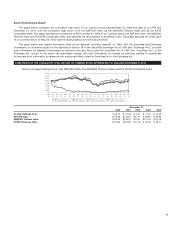
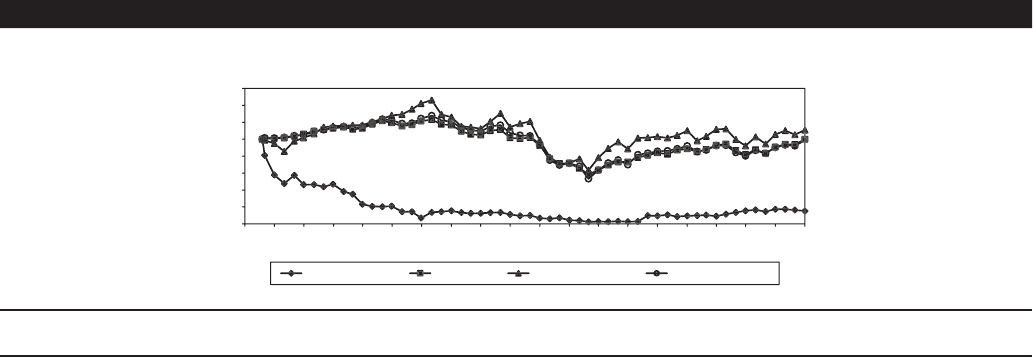
tock Performance
G
rap
h
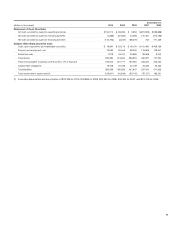
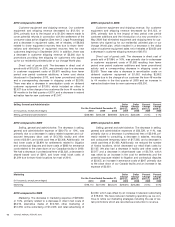
T
he graph below compares the cumulative total return of our common stock between May 24, 2006
(
the date of our IP
O)
an
d
December 31, 2010, with the cumulative total return of
(
1
)
the
S
&P 500 Index,
(
2
)
the NA
S
DA
Q
Telecom Index and
(
3
)
the NY
S
E
C
omposite Index. This graph assumes the investment of
$
100 on May 24, 2006 in our common stock, the S&P 500 Index, the NASDAQ
T
elecom Index and the NY
S
E
C
omposite Index, and assumes the reinvestment of dividends, if any. The graph assumes the initial value
of our common stock on May 24, 2006 was the closing sales price of
$
14.85 per share
.
T
he graph below and related information shall not be deemed “soliciting material” or “filed” with the
S
ecurities and Exchange
C
ommission or otherwise subject to the liabilities of
S
ection 18 of the
S
ecurities Exchange Act of 1934
(
the “Exchange Act”
)
, nor shal
l
s
uch information be deemed incorporated by reference into any filing under the
S
ecurities Act of 1933
(
the “
S
ecurities Act”
)
or th
e
Exchange Act, except to the extent we specifically request that such information be treated as soliciting material or specificall
y
i
ncorporate such information by reference into a document filed under the
S
ecurities Act or the Exchange Act
.
COMPARISON OF THE CUMULATIVE TOTAL RETURN ON COMMON STOCK BETWEEN MAY 24, 2006 AND DECEMBER 31, 2010
A
mong Vonage Holdings
C
orp., the
S
&P 500 Index, the NA
S
DA
Q
Telecom Index and the NY
S
E
C
omposite Index.
$-
$
20
$
40
$
60
$
80
$
100
$
120
$
140
$
160
Ma
r-
06
J
un
-
06
Se
p
-
06
Dec-
06
M
a
r
-
07
J
un-
07
Se
p
-
07
D
ec-
07
M
a
r
-
08
J
un
-
08
Se
p-
08
D
ec
-
08
M
a
r
-
09
J
un
-
09
Se
p-
09
Dec-
09
Ma
r
-
10
J
un
-
10
Se
p-
10
Dec-
10
Vonage Holdings Corp.
S&
P 500 Inde
x
NASDAQ Telecom Index NYSE Composite Inde
x
December 31,
2006 200
7
2008 2009 20
1
0
V
onage Holdings Corp.
$
46.73
$
15.49
$
4.44
$
9.43
$
15.08
S
&P 500 Index $112.69 $116.67 $71.77 $ 88.60 $ 99.93
NA
S
DA
Q
Telecom Inde
x
$
115.53
$
126.13
$
71.91
$
110.04
$
110.79
NY
S
E
C
omposite Inde
x
$
113.35
$
120.80
$
71.40
$
92.06
$
98.7
7
23