United Healthcare 2011 Annual Report Download - page 79
Download and view the complete annual report
Please find page 79 of the 2011 United Healthcare annual report below. You can navigate through the pages in the report by either clicking on the pages listed below, or by using the keyword search tool below to find specific information within the annual report.-
 1
1 -
2
-
3
-
4
-
5
-
6
-
7
-
8
-
9
-
10
-
11
-
12
-
13
-
14
-
15
-
16
-
17
-
18
-
19
-
20
-
21
-
22
-
23
-
24
-
25
-
26
-
27
-
28
-
29
-
30
-
31
-
32
-
33
-
34
-
35
-
36
-
37
-
38
-
39
-
40
-
41
-
42
-
43
-
44
-
45
-
46
-
47
-
48
-
49
-
50
-
51
-
52
-
53
-
54
-
55
-
56
-
57
-
58
-
59
-
60
-
61
-
62
-
63
-
64
-
65
-
66
-
67
-
68
-
 69
69 -
 70
70 -
 71
71 -
 72
72 -
 73
73 -
 74
74 -
 75
75 -
 76
76 -
 77
77 -
 78
78 -
 79
79 -
 80
80 -
 81
81 -
 82
82 -
 83
83 -
 84
84 -
 85
85 -
 86
86 -
 87
87 -
 88
88 -
 89
89 -
90
-
91
-
92
-
93
-
94
-
95
-
96
-
97
-
98
-
99
-
100
-
101
-
102
-
103
-
104
 |
 |

77
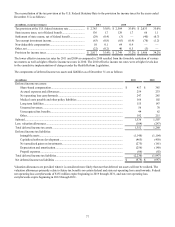
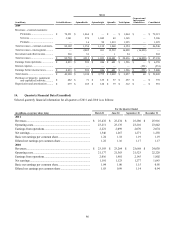
The reconciliation of the tax provision at the U.S. Federal Statutory Rate to the provision for income taxes for the years ended
December 31 is as follows:
(in millions, except percentages)
Tax provision at the U.S. federal statutory rate......................
State income taxes, net of federal benefit...............................
Settlement of state exams, net of federal benefit....................
Tax-exempt investment income..............................................
Non-deductible compensation ................................................
Other, net ................................................................................
Provision for income taxes .....................................................
2011
$ 2,785
136
(29)
(63)
10
(22)
$ 2,817
35.0%
1.7
(0.4)
(0.8)
0.1
(0.2)
35.4%
2010
$ 2,584
129
(3)
(65)
64
40
$ 2,749
35.0%
1.7
—
(0.9)
0.9
0.5
37.2%
2009
$ 2,033
66
(40)
(70)
—
(3)
$ 1,986
35.0%
1.1
(0.7)
(1.2)
—
—
34.2%
The lower effective income tax rates for 2011 and 2009 as compared to 2010 resulted from the favorable resolution of various
tax matters as well as higher effective income tax rates in 2010. The 2010 effective income tax rates were at higher levels due
to the cumulative implementation of changes under the Health Reform Legislation.
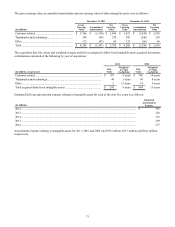
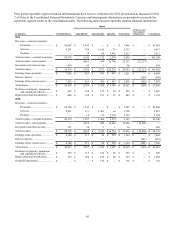
The components of deferred income tax assets and liabilities as of December 31 are as follows:
(in millions)
Deferred income tax assets:
Share-based compensation....................................................................................................
Accrued expenses and allowances ........................................................................................
Net operating loss carryforwards ..........................................................................................
Medical costs payable and other policy liabilities ................................................................
Long term liabilities..............................................................................................................
Unearned revenues................................................................................................................
Unrecognized tax benefits.....................................................................................................
Other......................................................................................................................................
Subtotal.........................................................................................................................................
Less: valuation allowances...........................................................................................................
Total deferred income tax assets..................................................................................................
Deferred income tax liabilities:
Intangible assets....................................................................................................................
Capitalized software development........................................................................................
Net unrealized gains on investments.....................................................................................
Depreciation and amortization..............................................................................................
Prepaid expenses...................................................................................................................
Total deferred income tax liabilities.............................................................................................
Net deferred income tax liabilities ...............................................................................................
2011
$ 417
259
247
166
155
56
44
192
1,536
(184)
1,352
(1,148)
(465)
(275)
(256)
(86)
(2,230)
$(878)
2010
$ 385
233
285
102
147
78
62
215
1,507
(247)
1,260
(1,104)
(450)
(161)
(140)
(92)
(1,947)
$(687)
Valuation allowances are provided when it is considered more likely than not that deferred tax assets will not be realized. The
valuation allowances primarily relate to future tax benefits on certain federal and state net operating loss carryforwards. Federal
net operating loss carryforwards of $151 million expire beginning in 2019 through 2031, and state net operating loss
carryforwards expire beginning in 2012 through 2031.