United Healthcare 2011 Annual Report Download - page 42
Download and view the complete annual report
Please find page 42 of the 2011 United Healthcare annual report below. You can navigate through the pages in the report by either clicking on the pages listed below, or by using the keyword search tool below to find specific information within the annual report.-
 1
1 -
2
-
3
-
4
-
5
-
6
-
7
-
8
-
9
-
10
-
11
-
12
-
13
-
14
-
15
-
16
-
17
-
18
-
19
-
20
-
21
-
22
-
23
-
24
-
25
-
26
-
27
-
28
-
29
-
30
-
31
-
 32
32 -
 33
33 -
 34
34 -
 35
35 -
 36
36 -
 37
37 -
 38
38 -
 39
39 -
 40
40 -
 41
41 -
 42
42 -
 43
43 -
 44
44 -
 45
45 -
 46
46 -
 47
47 -
 48
48 -
 49
49 -
 50
50 -
 51
51 -
 52
52 -
53
-
54
-
55
-
56
-
57
-
58
-
59
-
60
-
61
-
62
-
63
-
64
-
65
-
66
-
67
-
68
-
69
-
70
-
71
-
72
-
73
-
74
-
75
-
76
-
77
-
78
-
79
-
80
-
81
-
82
-
83
-
84
-
85
-
86
-
87
-
88
-
89
-
90
-
91
-
92
-
93
-
94
-
95
-
96
-
97
-
98
-
99
-
100
-
101
-
102
-
103
-
104
 |
 |

40
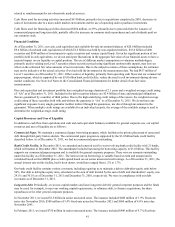
In 2011, based on the 2010 statutory net income and statutory capital and surplus levels, the maximum amount of ordinary
dividends which could be paid was $3.4 billion. For the year ended December 31, 2011, our regulated subsidiaries paid their
parent companies dividends of $4.5 billion, including $1.1 billion of extraordinary dividends. For the year ended December 31,
2010, our regulated subsidiaries paid their parent companies dividends of $3.2 billion, including $686 million of extraordinary
dividends.
Our non-regulated businesses also generate cash flows from operations for general corporate use. Cash flows generated by
these entities, combined with dividends from our regulated entities and financing through the issuance of long term debt as well
as issuance of commercial paper or drawings under our committed credit facility, further strengthen our operating and financial
flexibility. We use these cash flows to expand our businesses through acquisitions, reinvest in our businesses through capital
expenditures, repay debt, or return capital to our shareholders through shareholder dividends and/or repurchases of our
common stock, depending on market conditions.
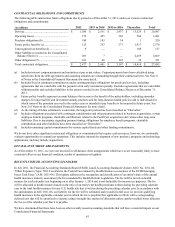
Summary of our Major Sources and Uses of Cash
(in millions)
Sources of cash:
Cash provided by operating activities...........................................................................
Issuance of long-term debt and commercial paper, net of repayments.........................
Interest rate swap termination.......................................................................................
Proceeds from customer funds administered ................................................................
Sales and maturities of investments, net of purchases..................................................
Other..............................................................................................................................
Total sources of cash............................................................................................................
Uses of cash:
Common stock repurchases ..........................................................................................
Purchases of investments, net of sales and maturities ..................................................
Cash paid for acquisitions, net of cash assumed and dispositions................................
Purchases of property, equipment and capitalized software, net of dispositions..........
Dividends paid ..............................................................................................................
Repayments of long-term debt and commercial paper .................................................
Other..............................................................................................................................
Total uses of cash.................................................................................................................
Net increase (decrease) in cash ............................................................................................
For the Year Ended December 31,
2011
$ 6,968
346
132
37
—
640
8,123
(2,994)
(1,695)
(1,459)
(1,018)
(651)
—
—
(7,817)
$ 306
2010
$ 6,273
94
—
974
—
292
7,633
(2,517)
(2,157)
(2,304)
(878)
(449)
—
(5)
(8,310)
$(677)
2009
$ 5,625
—
513
204
249
304
6,895
(1,801)
—
(486)
(739)
(36)
(1,449)
(10)
(4,521)
$ 2,374
2011 Cash Flows Compared to 2010 Cash Flows
Cash flows from operating activities increased $695 million, or 11%, from 2010. The increase was primarily driven by growth
in net earnings and changes in various working capital accounts, which were partially offset by a reduction in unearned
revenues due to the early receipt of certain 2011 state Medicaid premium payments in 2010, which increased 2010 cash from
operating activities. We anticipate lower year over year cash flows from operations in 2012, which will include payments in the
third quarter for 2011 premium rebate obligations.
Cash flows used for investing activities decreased $1.2 billion, or 22%, primarily due to relatively lower investments in
acquisitions in 2011 and a decrease in net purchases of investments. We anticipate an increase in cash paid for acquisitions in
2012 as compared to 2011.
Cash flows used for financing activities increased $879 million, or 55%, primarily due to increased share repurchases and cash
dividends in 2011, partially offset by an increase in net borrowings.
2010 Cash Flows Compared to 2009 Cash Flows
Cash flows from operating activities increased $648 million, or 12%, for 2010. Factors that increased cash flows from
operating activities were growth in net earnings, an acceleration of certain 2011 premium payments, and an increase in
pharmacy rebate collections, which were partially offset by a mandated acceleration in the claim payment cycle associated with
the Medicare Part D program and payment for the settlement of the American Medical Association class action litigation