United Healthcare 2011 Annual Report Download - page 36
Download and view the complete annual report
Please find page 36 of the 2011 United Healthcare annual report below. You can navigate through the pages in the report by either clicking on the pages listed below, or by using the keyword search tool below to find specific information within the annual report.-
 1
1 -
2
-
3
-
4
-
5
-
6
-
7
-
8
-
9
-
10
-
11
-
12
-
13
-
14
-
15
-
16
-
17
-
18
-
19
-
20
-
21
-
22
-
23
-
24
-
25
-
 26
26 -
 27
27 -
 28
28 -
 29
29 -
 30
30 -
 31
31 -
 32
32 -
 33
33 -
 34
34 -
 35
35 -
 36
36 -
 37
37 -
 38
38 -
 39
39 -
 40
40 -
 41
41 -
 42
42 -
 43
43 -
 44
44 -
 45
45 -
 46
46 -
47
-
48
-
49
-
50
-
51
-
52
-
53
-
54
-
55
-
56
-
57
-
58
-
59
-
60
-
61
-
62
-
63
-
64
-
65
-
66
-
67
-
68
-
69
-
70
-
71
-
72
-
73
-
74
-
75
-
76
-
77
-
78
-
79
-
80
-
81
-
82
-
83
-
84
-
85
-
86
-
87
-
88
-
89
-
90
-
91
-
92
-
93
-
94
-
95
-
96
-
97
-
98
-
99
-
100
-
101
-
102
-
103
-
104
 |
 |

34
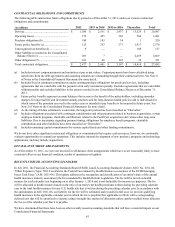
RESULTS SUMMARY
(in millions, except percentages and per share data)
Revenues:
Premiums..................................................
Services ....................................................
Products....................................................
Investment and other income ...................
Total revenues..................................................
Operating costs:
Medical costs............................................
Operating costs.........................................
Cost of products sold................................
Depreciation and amortization .................
Total operating costs........................................
Earnings from operations ................................
Interest expense........................................
Earnings before income taxes..........................
Provision for income taxes..............................
Net earnings.....................................................
Diluted net earnings per common share..........
Medical care ratio (a).......................................
Operating cost ratio (b)....................................
Operating margin.............................................
Tax rate............................................................
Net margin.......................................................
Return on equity (c).........................................
2011
$ 91,983
6,613
2,612
654
101,862
74,332
15,557
2,385
1,124
93,398
8,464
(505)
7,959
(2,817)
$ 5,142
$ 4.73
80.8%
15.3
8.3
35.4
5.0
18.9%
2010
$85,405
5,819
2,322
609
94,155
68,841
14,270
2,116
1,064
86,291
7,864
(481)
7,383
(2,749)
$ 4,634
$ 4.10
80.6%
15.2
8.4
37.2
4.9
18.7%
2009
$79,315
5,306
1,925
592
87,138
65,289
12,734
1,765
991
80,779
6,359
(551)
5,808
(1,986)
$ 3,822
$ 3.24
82.3%
14.6
7.3
34.2
4.4
17.3%
Change
2011 vs. 2010
$ 6,578
794
290
45
7,707
5,491
1,287
269
60
7,107
600
24
576
68
$ 508
$ 0.63
0.2%
0.1
(0.1)
(1.8)
0.1
0.2%
8%
14
12
7
8
8
9
13
6
8
8
5
8
2
11%
15%
Change
2010 vs. 2009
$ 6,090
513
397
17
7,017
3,552
1,536
351
73
5,512
1,505
(70)
1,575
763
$ 812
$ 0.86
(1.7)%
0.6
1.1
3.0
0.5
1.4%
8%
10
21
3
8
5
12
20
7
7
24
(13)
27
38
21%
27%
(a) Medical care ratio is calculated as medical costs divided by premium revenue.
(b) Operating cost ratio is calculated as operating costs divided by total revenues.
(c) Return on equity is calculated as net earnings divided by average equity. Average equity is calculated using the equity
balance at the end of the preceding year and the equity balances at the end of the four quarters of the year presented.
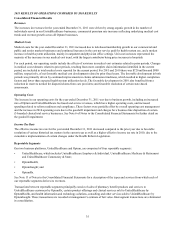
SELECTED OPERATING PERFORMANCE AND FINANCIAL LIQUIDITY ITEMS
The following represents a summary of selected 2011 operating and liquidity items. These matters should not be considered by
themselves; see below for further discussion and analysis.
• Consolidated total revenues of $102 billion increased 8% over 2010.
• UnitedHealthcare revenues of $95 billion rose 7% over 2010.
• Optum revenues of $29 billion increased 21% over 2010.
• UnitedHealthcare enrollment during 2011 grew by 1.6 million people in 2011.
• Consolidated medical care ratio of 80.8% increased 20 basis points over 2010.
• Net earnings of $5 billion and diluted earnings per share of $4.73 are up 11% and 15%, respectively over 2010.
• Return on Equity of 18.9% increased 20 basis points over 2010.
• Operating cash flows of $7 billion rose 11% over 2010.
• Liquidity:
Extended our credit agreement to December 2016 and increased capacity to $3 billion.
2011 debt offerings raised new debt totaling $2.25 billion.
Debt to debt-plus-equity ratio decreased 100 basis points from 2010 to 29.1%.