United Healthcare 2011 Annual Report Download - page 67
Download and view the complete annual report
Please find page 67 of the 2011 United Healthcare annual report below. You can navigate through the pages in the report by either clicking on the pages listed below, or by using the keyword search tool below to find specific information within the annual report.-
 1
1 -
2
-
3
-
4
-
5
-
6
-
7
-
8
-
9
-
10
-
11
-
12
-
13
-
14
-
15
-
16
-
17
-
18
-
19
-
20
-
21
-
22
-
23
-
24
-
25
-
26
-
27
-
28
-
29
-
30
-
31
-
32
-
33
-
34
-
35
-
36
-
37
-
38
-
39
-
40
-
41
-
42
-
43
-
44
-
45
-
46
-
47
-
48
-
49
-
50
-
51
-
52
-
53
-
54
-
55
-
56
-
 57
57 -
 58
58 -
 59
59 -
 60
60 -
 61
61 -
 62
62 -
 63
63 -
 64
64 -
 65
65 -
 66
66 -
 67
67 -
 68
68 -
 69
69 -
 70
70 -
 71
71 -
 72
72 -
 73
73 -
 74
74 -
 75
75 -
 76
76 -
 77
77 -
78
-
79
-
80
-
81
-
82
-
83
-
84
-
85
-
86
-
87
-
88
-
89
-
90
-
91
-
92
-
93
-
94
-
95
-
96
-
97
-
98
-
99
-
100
-
101
-
102
-
103
-
104
 |
 |

65
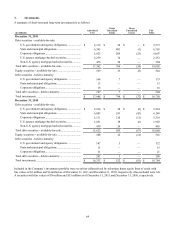
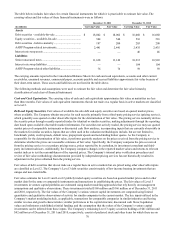
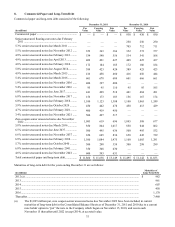
The fair values of the Company’s mortgage-backed securities by credit rating (when multiple credit ratings are available for an
individual security, the average of the available ratings is used) and origination as of December 31, 2011 were as follows:
(in millions)
2011............................................................
2010............................................................
2007............................................................
2006............................................................
2005............................................................
Pre - 2005 ...................................................
U.S. agency mortgage-backed securities....
Total............................................................
AAA
$ 26
—
93
167
136
60
2,353
$ 2,835
AA
$ —
3
—
—
—
—
—
$ 3
A
$ —
—
—
—
—
3
—
$ 3
Non-Investment
Grade
$ —
—
3
10
3
—
—
$ 16
Total Fair
Value
$ 26
3
96
177
139
63
2,353
$ 2,857
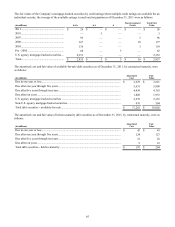
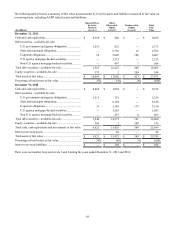
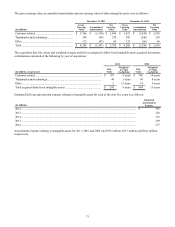
The amortized cost and fair value of available-for-sale debt securities as of December 31, 2011, by contractual maturity, were
as follows:
(in millions)
Due in one year or less..............................................................................................................
Due after one year through five years.......................................................................................
Due after five years through ten years ......................................................................................
Due after ten years ....................................................................................................................
U.S. agency mortgage-backed securities ..................................................................................
Non-U.S. agency mortgage-backed securities ..........................................................................
Total debt securities - available-for-sale...................................................................................
Amortized
Cost
$ 2,629
5,631
4,439
1,808
2,279
476
$ 17,262
Fair
Value
$ 2,641
5,808
4,763
1,933
2,353
504
$ 18,002
The amortized cost and fair value of held-to-maturity debt securities as of December 31, 2011, by contractual maturity, were as
follows:
(in millions)
Due in one year or less..............................................................................................................
Due after one year through five years.......................................................................................
Due after five years through ten years ......................................................................................
Due after ten years ....................................................................................................................
Total debt securities - held-to-maturity.....................................................................................
Amortized
Cost
$ 43
124
21
9
$ 197
Fair
Value
$ 43
127
22
12
$ 204