United Healthcare 2011 Annual Report Download - page 68
Download and view the complete annual report
Please find page 68 of the 2011 United Healthcare annual report below. You can navigate through the pages in the report by either clicking on the pages listed below, or by using the keyword search tool below to find specific information within the annual report.-
 1
1 -
2
-
3
-
4
-
5
-
6
-
7
-
8
-
9
-
10
-
11
-
12
-
13
-
14
-
15
-
16
-
17
-
18
-
19
-
20
-
21
-
22
-
23
-
24
-
25
-
26
-
27
-
28
-
29
-
30
-
31
-
32
-
33
-
34
-
35
-
36
-
37
-
38
-
39
-
40
-
41
-
42
-
43
-
44
-
45
-
46
-
47
-
48
-
49
-
50
-
51
-
52
-
53
-
54
-
55
-
56
-
57
-
 58
58 -
 59
59 -
 60
60 -
 61
61 -
 62
62 -
 63
63 -
 64
64 -
 65
65 -
 66
66 -
 67
67 -
 68
68 -
 69
69 -
 70
70 -
 71
71 -
 72
72 -
 73
73 -
 74
74 -
 75
75 -
 76
76 -
 77
77 -
 78
78 -
79
-
80
-
81
-
82
-
83
-
84
-
85
-
86
-
87
-
88
-
89
-
90
-
91
-
92
-
93
-
94
-
95
-
96
-
97
-
98
-
99
-
100
-
101
-
102
-
103
-
104
 |
 |

66
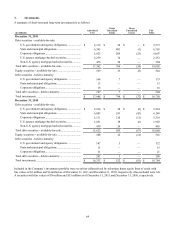
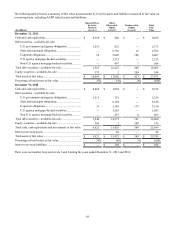
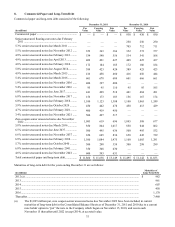
The fair value of available-for-sale investments with gross unrealized losses by investment type and length of time that
individual securities have been in a continuous unrealized loss position were as follows:
(in millions)
December 31, 2011
Debt securities - available-for-sale:
State and municipal obligations.........
Corporate obligations ........................
Total debt securities - available-for-sale...
Equity securities - available-for-sale ........
December 31, 2010
Debt securities - available-for-sale:
U.S. government and agency
obligations......................................
State and municipal obligations.........
Corporate obligations ........................
U.S. agency mortgage-backed
securities ........................................
Total debt securities - available-for-sale...
Equity securities - available-for-sale ........
Less Than 12 Months
Fair
Value
$ 85
1,496
$ 1,581
$ 24
$ 548
1,383
949
355
$ 3,235
$ 206
Gross
Unrealized
Losses
$(1)
(22)
$(23)
$(7)
$(8)
(40)
(11)
(6)
$(65)
$(14)
12 Months or Greater
Fair
Value
$ 21
28
$ 49
$ 3
$ —
18
14
—
$ 32
$ 11
Gross
Unrealized
Losses
$ —
(1)
$(1)
$(1)
$ —
(2)
—
—
$(2)
$ —
Total
Fair
Value
$ 106
1,524
$ 1,630
$ 27
$ 548
1,401
963
355
$ 3,267
$ 217
Gross
Unrealized
Losses
$(1)
(23)
$(24)
$(8)
$(8)
(42)
(11)
(6)
$(67)
$(14)
The unrealized losses from all securities as of December 31, 2011 were generated from 2,100 positions out of a total of 15,300
positions. The Company believes that it will collect the principal and interest due on its investments that have an amortized cost
in excess of fair value. The unrealized losses on investments in state and municipal obligations and corporate obligations as of
December 31, 2011 were primarily caused by interest rate increases and not by unfavorable changes in the credit ratings
associated with these securities. At each reporting period, the Company evaluates securities for impairment when the fair value
of the investment is less than its amortized cost. The Company evaluated the underlying credit quality of the issuers and the
credit ratings of the state and municipal obligations and the corporate obligations, noting neither a significant deterioration
since purchase nor other factors leading to an other-than-temporary impairment (OTTI). As of December 31, 2011, the
Company did not have the intent to sell any of the securities in an unrealized loss position.
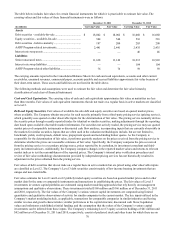
As of December 31, 2011, the Company’s holdings of non-U.S. agency mortgage-backed securities included $7 million of
commercial mortgage loans in default. They represented less than 1% of the Company’s total mortgage-backed security
holdings as of December 31, 2011.
A portion of the Company’s investments in equity securities and venture capital funds consists of investments held in various
public and nonpublic companies concentrated in the areas of health care services and related information technologies. Market
conditions that affect the value of health care and related technology stocks will likewise impact the value of the Company’s
equity portfolio. The equity securities and venture capital funds were evaluated for severity and duration of unrealized loss,
overall market volatility and other market factors.
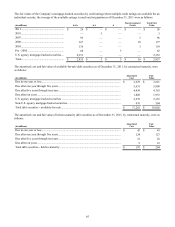
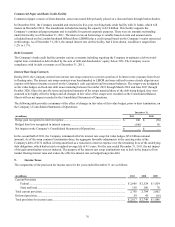
Net realized gains included in Investment and Other Income on the Consolidated Statements of Operations were from the
following sources:
(in millions)
Total OTTI.....................................................................................................
Portion of loss recognized in other comprehensive income..........................
Net OTTI recognized in earnings..................................................................
Gross realized losses from sales....................................................................
Gross realized gains from sales.....................................................................
Net realized gains ..........................................................................................
For the Year Ended December 31,
2011
$(12)
—
(12)
(11)
136
$ 113
2010
$(23)
—
(23)
(6)
100
$ 71
2009
$(64)
—
(64)
(41)
116
$ 11
For the years ended December 31, 2011, 2010 and 2009, all of the recorded OTTI charges resulted from the Company’s intent
to sell certain impaired securities.