United Healthcare 2011 Annual Report Download - page 75
Download and view the complete annual report
Please find page 75 of the 2011 United Healthcare annual report below. You can navigate through the pages in the report by either clicking on the pages listed below, or by using the keyword search tool below to find specific information within the annual report.-
 1
1 -
2
-
3
-
4
-
5
-
6
-
7
-
8
-
9
-
10
-
11
-
12
-
13
-
14
-
15
-
16
-
17
-
18
-
19
-
20
-
21
-
22
-
23
-
24
-
25
-
26
-
27
-
28
-
29
-
30
-
31
-
32
-
33
-
34
-
35
-
36
-
37
-
38
-
39
-
40
-
41
-
42
-
43
-
44
-
45
-
46
-
47
-
48
-
49
-
50
-
51
-
52
-
53
-
54
-
55
-
56
-
57
-
58
-
59
-
60
-
61
-
62
-
63
-
64
-
 65
65 -
 66
66 -
 67
67 -
 68
68 -
 69
69 -
 70
70 -
 71
71 -
 72
72 -
 73
73 -
 74
74 -
 75
75 -
 76
76 -
 77
77 -
 78
78 -
 79
79 -
 80
80 -
 81
81 -
 82
82 -
 83
83 -
 84
84 -
 85
85 -
86
-
87
-
88
-
89
-
90
-
91
-
92
-
93
-
94
-
95
-
96
-
97
-
98
-
99
-
100
-
101
-
102
-
103
-
104
 |
 |

73
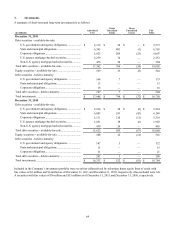
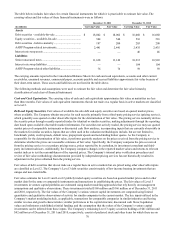
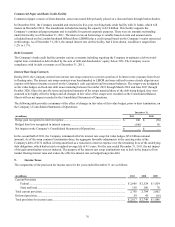
The gross carrying value, accumulated amortization and net carrying value of other intangible assets were as follows:
(in millions)
Customer-related.....................................................
Trademarks and technology....................................
Other .......................................................................
Total........................................................................
December 31, 2011
Gross
Carrying
Value
$ 3,766
368
112
$ 4,246
Accumulated
Amortization
$(1,310)
(98)
(43)
$(1,451)
Net
Carrying
Value
$ 2,456
270
69
$ 2,795
December 31, 2010
Gross
Carrying
Value
$ 3,623
505
132
$ 4,260
Accumulated
Amortization
$(1,038)
(246)
(66)
$(1,350)
Net
Carrying
Value
$ 2,585
259
66
$ 2,910
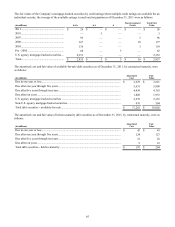
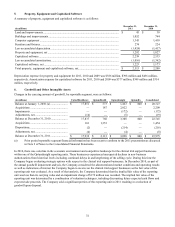
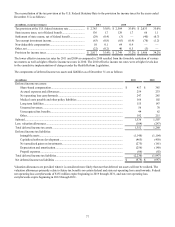
The acquisition date fair values and weighted-average useful lives assigned to finite-lived intangible assets acquired in business
combinations consisted of the following by year of acquisition:
(in millions, except years)
Customer-related.............................................................................................
Trademarks and technology............................................................................
Other ...............................................................................................................
Total acquired finite-lived intangible assets...................................................
2011
Fair
Value
$ 187
49
5
$ 241
Weighted-
Average
Useful Life
9 years
5 years
15 years
9 years
2010
Fair
Value
$ 786
94
14
$ 894
Weighted-
Average
Useful Life
14 years
8 years
9 years
13 years
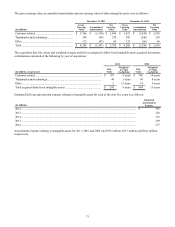
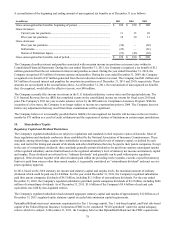
Estimated full year amortization expense relating to intangible assets for each of the next five years is as follows:
(in millions)
2012................................................................................................................................................................
2013................................................................................................................................................................
2014................................................................................................................................................................
2015................................................................................................................................................................
2016................................................................................................................................................................
Estimated
Amortization
Expense
$ 361
328
316
299
277
Amortization expense relating to intangible assets for 2011, 2010 and 2009 was $361 million, $317 million and $241 million,
respectively.