United Healthcare 2011 Annual Report Download - page 53
Download and view the complete annual report
Please find page 53 of the 2011 United Healthcare annual report below. You can navigate through the pages in the report by either clicking on the pages listed below, or by using the keyword search tool below to find specific information within the annual report.-
 1
1 -
2
-
3
-
4
-
5
-
6
-
7
-
8
-
9
-
10
-
11
-
12
-
13
-
14
-
15
-
16
-
17
-
18
-
19
-
20
-
21
-
22
-
23
-
24
-
25
-
26
-
27
-
28
-
29
-
30
-
31
-
32
-
33
-
34
-
35
-
36
-
37
-
38
-
39
-
40
-
41
-
42
-
 43
43 -
 44
44 -
 45
45 -
 46
46 -
 47
47 -
 48
48 -
 49
49 -
 50
50 -
 51
51 -
 52
52 -
 53
53 -
 54
54 -
 55
55 -
 56
56 -
 57
57 -
 58
58 -
 59
59 -
 60
60 -
 61
61 -
 62
62 -
 63
63 -
64
-
65
-
66
-
67
-
68
-
69
-
70
-
71
-
72
-
73
-
74
-
75
-
76
-
77
-
78
-
79
-
80
-
81
-
82
-
83
-
84
-
85
-
86
-
87
-
88
-
89
-
90
-
91
-
92
-
93
-
94
-
95
-
96
-
97
-
98
-
99
-
100
-
101
-
102
-
103
-
104
 |
 |

51
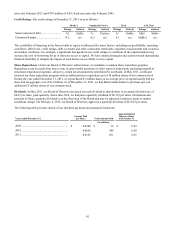
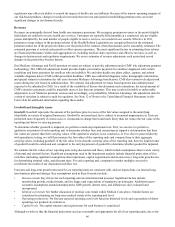
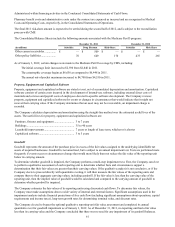
The following tables summarize the impact of hypothetical changes in market interest rates across the entire yield curve by 1%
or 2% as of December 31, 2011 and 2010 on our investment income and interest expense per annum, and the fair value of our
investments and debt (in millions):
Increase (Decrease) in Market Interest Rate
2 % .....................................................................................
1..........................................................................................
(1).......................................................................................
(2).......................................................................................
December 31, 2011
Investment
Income Per
Annum (a)
$ 199
99
(12)
nm
Interest
Expense Per
Annum (a)
$ 28
14
(4)
nm
Fair Value of
Investments (b)
$(1,239)
(622)
586
885
Fair Value of
Debt
$(1,946)
(1,082)
1,086
2,343
Increase (Decrease) in Market Interest Rate
2 % .....................................................................................
1..........................................................................................
(1).......................................................................................
(2).......................................................................................
December 31, 2010
Investment
Income Per
Annum (a)
$ 182
91
(10)
nm
Interest
Expense Per
Annum (a)
$ 163
82
(21)
nm
Fair Value of
Investments
$(1,177)
(602)
613
1,227
Fair Value of
Debt
$(860)
(471)
560
1,240
nm = not meaningful
(a) Given the low absolute level of short-term market rates on our floating-rate assets and liabilities as of December 31,
2011 and 2010, the assumed hypothetical change in interest rates does not reflect the full 1% point reduction in
interest income or interest expense as the rate cannot fall below zero and thus the 2% point reduction is not
meaningful.
(b) As of December 31, 2011, some of our investments had interest rates below 2% so the assumed hypothetical change in
the fair value of investments does not reflect the full 2% point reduction.
As of December 31, 2011, we had $544 million of investments in equity securities and venture capital funds, a portion of which
were invested in various public and non-public companies concentrated in the areas of health care delivery and related
information technologies. Market conditions that affect the value of health care or technology stocks will impact the value of
our equity investments.