United Healthcare 2011 Annual Report Download - page 56
Download and view the complete annual report
Please find page 56 of the 2011 United Healthcare annual report below. You can navigate through the pages in the report by either clicking on the pages listed below, or by using the keyword search tool below to find specific information within the annual report.-
 1
1 -
2
-
3
-
4
-
5
-
6
-
7
-
8
-
9
-
10
-
11
-
12
-
13
-
14
-
15
-
16
-
17
-
18
-
19
-
20
-
21
-
22
-
23
-
24
-
25
-
26
-
27
-
28
-
29
-
30
-
31
-
32
-
33
-
34
-
35
-
36
-
37
-
38
-
39
-
40
-
41
-
42
-
43
-
44
-
45
-
 46
46 -
 47
47 -
 48
48 -
 49
49 -
 50
50 -
 51
51 -
 52
52 -
 53
53 -
 54
54 -
 55
55 -
 56
56 -
 57
57 -
 58
58 -
 59
59 -
 60
60 -
 61
61 -
 62
62 -
 63
63 -
 64
64 -
 65
65 -
 66
66 -
67
-
68
-
69
-
70
-
71
-
72
-
73
-
74
-
75
-
76
-
77
-
78
-
79
-
80
-
81
-
82
-
83
-
84
-
85
-
86
-
87
-
88
-
89
-
90
-
91
-
92
-
93
-
94
-
95
-
96
-
97
-
98
-
99
-
100
-
101
-
102
-
103
-
104
 |
 |

54
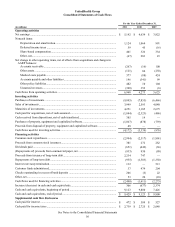
UnitedHealth Group
Consolidated Statements of Operations
(in millions, except per share data)
Revenues:
Premiums ............................................................................
Services...............................................................................
Products...............................................................................
Investment and other income..............................................
Total revenues.............................................................................
Operating costs:
Medical costs.......................................................................
Operating costs....................................................................
Cost of products sold...........................................................
Depreciation and amortization............................................
Total operating costs...................................................................
Earnings from operations ...........................................................
Interest expense..........................................................................
Earnings before income taxes ....................................................
Provision for income taxes.........................................................
Net earnings................................................................................
Basic net earnings per common share........................................
Diluted net earnings per common share.....................................
Basic weighted-average number of common shares
outstanding..............................................................................
Dilutive effect of common stock equivalents.............................
Diluted weighted-average number of common shares
outstanding..............................................................................
Anti-dilutive shares excluded from the calculation of dilutive
effect of common stock equivalents .......................................
Cash dividends declared per common share ..............................
For the Year Ended December 31,
2011
$ 91,983
6,613
2,612
654
101,862
74,332
15,557
2,385
1,124
93,398
8,464
(505)
7,959
(2,817)
$ 5,142
$ 4.81
$ 4.73
1,070
17
1,087
47
$ 0.6125
2010
$ 85,405
5,819
2,322
609
94,155
68,841
14,270
2,116
1,064
86,291
7,864
(481)
7,383
(2,749)
$ 4,634
$ 4.14
$ 4.10
1,120
11
1,131
94
$ 0.4050
2009
$ 79,315
5,306
1,925
592
87,138
65,289
12,734
1,765
991
80,779
6,359
(551)
5,808
(1,986)
$ 3,822
$ 3.27
$ 3.24
1,168
11
1,179
107
$ 0.0300
See Notes to the Consolidated Financial Statements