United Healthcare 2011 Annual Report Download - page 48
Download and view the complete annual report
Please find page 48 of the 2011 United Healthcare annual report below. You can navigate through the pages in the report by either clicking on the pages listed below, or by using the keyword search tool below to find specific information within the annual report.-
 1
1 -
2
-
3
-
4
-
5
-
6
-
7
-
8
-
9
-
10
-
11
-
12
-
13
-
14
-
15
-
16
-
17
-
18
-
19
-
20
-
21
-
22
-
23
-
24
-
25
-
26
-
27
-
28
-
29
-
30
-
31
-
32
-
33
-
34
-
35
-
36
-
37
-
 38
38 -
 39
39 -
 40
40 -
 41
41 -
 42
42 -
 43
43 -
 44
44 -
 45
45 -
 46
46 -
 47
47 -
 48
48 -
 49
49 -
 50
50 -
 51
51 -
 52
52 -
 53
53 -
 54
54 -
 55
55 -
 56
56 -
 57
57 -
 58
58 -
59
-
60
-
61
-
62
-
63
-
64
-
65
-
66
-
67
-
68
-
69
-
70
-
71
-
72
-
73
-
74
-
75
-
76
-
77
-
78
-
79
-
80
-
81
-
82
-
83
-
84
-
85
-
86
-
87
-
88
-
89
-
90
-
91
-
92
-
93
-
94
-
95
-
96
-
97
-
98
-
99
-
100
-
101
-
102
-
103
-
104
 |
 |
46
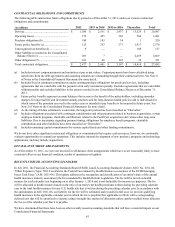
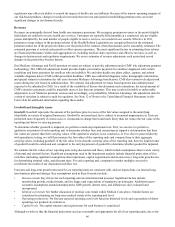
regulations may affect our ability to control the impact of health care cost inflation. Because of the narrow operating margins of
our risk-based products, changes in medical cost trends that were not anticipated in establishing premium rates can create
significant changes in our financial results.
Revenues
Revenues are principally derived from health care insurance premiums. We recognize premium revenues in the period eligible
individuals are entitled to receive health care services. Customers are typically billed monthly at a contracted rate per eligible
person multiplied by the total number of people eligible to receive services, as recorded in our records. Effective in 2011,
premium revenue subject to the premium rebates of the Health Reform Legislation are recognized based on the estimated
premium earned net of the projected rebates over the period of the contract, when that amount can be reasonably estimated. The
estimated premium is revised each period to reflect current experience. The most significant factors in estimating these rebates
are financial performance within each aggregation set, including medical claim experience and effective tax rates, as well as
changes in business mix and regulatory requirements. We revise estimates of revenue adjustments each period and record
changes in the period they become known.
Our Medicare Advantage and Part D premium revenues are subject to periodic adjustment under CMS' risk adjustment payment
methodology. The CMS risk adjustment model provides higher per member payments for enrollees diagnosed with certain
conditions and lower payments for enrollees who are healthier. We and other health care plans collect, capture, and submit
available diagnosis data to CMS within prescribed deadlines. CMS uses submitted diagnosis codes, demographic information,
and special statuses to determine the risk score for most Medicare Advantage beneficiaries. CMS also retroactively adjusts risk
scores during the year based on additional data. We estimate risk adjustment revenues based upon the data submitted and
expected to be submitted to CMS. As a result of the variability of factors that determine such estimations, the actual amount of
CMS' retroactive payments could be materially more or less than our estimates. This may result in favorable or unfavorable
adjustments to our Medicare premium revenue and, accordingly, our profitability. Medicare Advantage risk adjustment data for
certain of our plans is subject to audit by regulators. See Note 12 of Notes to the Consolidated Financial Statements in this
Form 10-K for additional information regarding these audits.
Goodwill and Intangible Assets
Goodwill. Goodwill represents the amount of the purchase price in excess of the fair values assigned to the underlying
identifiable net assets of acquired businesses. Goodwill is not amortized, but is subject to an annual impairment test. Tests are
performed more frequently if events occur or circumstances change that would more likely than not reduce the fair value of the
reporting unit below its carrying amount.
To determine whether goodwill is impaired, we perform a multi-step impairment test. First, we can elect to perform a
qualitative assessment of each reporting unit to determine whether facts and circumstances support a determination that their
fair values are greater than their carrying values. If the qualitative analysis is not conclusive, or if we elect to proceed directly
with quantitative testing, we will then measure the fair values of the reporting units and compare them to their aggregate
carrying values, including goodwill. If the fair value is less than the carrying value of the reporting unit, then the implied value
of goodwill would be calculated and compared to the carrying amount of goodwill to determine whether goodwill is impaired.
We estimate the fair values of our reporting units using discounted cash flows, which include assumptions about a wide variety
of internal and external factors. Significant assumptions used in the impairment analysis include financial projections of free
cash flow (including significant assumptions about operations, capital requirements and income taxes), long-term growth rates
for determining terminal value, and discount rates. For each reporting unit, comparative market multiples are used to
corroborate the results of our discounted cash flow test.
Forecasts and long-term growth rates used for our reporting units are consistent with, and use inputs from, our internal long-
term business plan and strategy. Key assumptions used in these forecasts include:
• Revenue trends. Key drivers for each reporting unit are determined and assessed. Significant factors include:
membership growth, medical trends, and the impact and expectations of regulatory environments. Additional macro-
economic assumptions around unemployment, GDP growth, interest rates, and inflation are also evaluated and
incorporated.
• Medical cost trends. See further discussion of medical costs trends within Medical Costs above. Similar factors are
considered in estimating our long-term medical trends at the reporting unit level.
• Operating productivity. We forecast expected operating cost levels based on historical levels and expectations of future
operating cost productivity initiatives.
• Capital levels. The capital structure and requirements for each business is considered.
Although we believe that the financial projections used are reasonable and appropriate for all of our reporting units, due to the