United Healthcare 2011 Annual Report Download - page 39
Download and view the complete annual report
Please find page 39 of the 2011 United Healthcare annual report below. You can navigate through the pages in the report by either clicking on the pages listed below, or by using the keyword search tool below to find specific information within the annual report.-
 1
1 -
2
-
3
-
4
-
5
-
6
-
7
-
8
-
9
-
10
-
11
-
12
-
13
-
14
-
15
-
16
-
17
-
18
-
19
-
20
-
21
-
22
-
23
-
24
-
25
-
26
-
27
-
28
-
 29
29 -
 30
30 -
 31
31 -
 32
32 -
 33
33 -
 34
34 -
 35
35 -
 36
36 -
 37
37 -
 38
38 -
 39
39 -
 40
40 -
 41
41 -
 42
42 -
 43
43 -
 44
44 -
 45
45 -
 46
46 -
 47
47 -
 48
48 -
 49
49 -
50
-
51
-
52
-
53
-
54
-
55
-
56
-
57
-
58
-
59
-
60
-
61
-
62
-
63
-
64
-
65
-
66
-
67
-
68
-
69
-
70
-
71
-
72
-
73
-
74
-
75
-
76
-
77
-
78
-
79
-
80
-
81
-
82
-
83
-
84
-
85
-
86
-
87
-
88
-
89
-
90
-
91
-
92
-
93
-
94
-
95
-
96
-
97
-
98
-
99
-
100
-
101
-
102
-
103
-
104
 |
 |

37
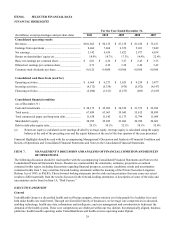
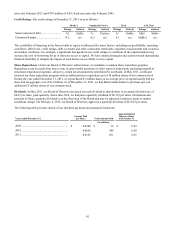
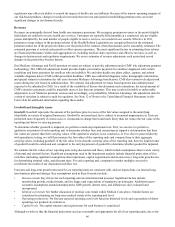
The following table summarizes the number of individuals served by our UnitedHealthcare businesses, by major market
segment and funding arrangement:
(in thousands, except percentages)
Commercial risk-based.....................................................
Commercial fee-based ......................................................
Total commercial..............................................................
Medicare Advantage.........................................................
Medicaid ...........................................................................
Medicare Supplement.......................................................
Total public and senior......................................................
Total UnitedHealthcare - medical.....................................
Supplemental Data:
Medicare Part D stand-alone .....................................
2011
9,550
16,320
25,870
2,240
3,525
2,935
8,700
34,570
4,855
2010
9,405
15,405
24,810
2,070
3,320
2,770
8,160
32,970
4,530
2009
9,415
15,210
24,625
1,790
2,900
2,680
7,370
31,995
4,300
Change
2011 vs. 2010
145
915
1,060
170
205
165
540
1,600
325
2%
6
4
8
6
6
7
5%
7%
Change
2010 vs. 2009
(10)
195
185
280
420
90
790
975
230
— %
1
1
16
14
3
11
3 %
5 %
UnitedHealthcare's revenue growth for the year ended December 31, 2011 was due to growth in the number of individuals
served across our businesses and commercial premium rate increases reflecting expected underlying medical cost trends.
UnitedHealthcare's earnings from operations for the year ended December 31, 2011 increased compared to the prior year as
revenue growth and improvements in the operating cost ratio more than offset increased compliance costs and an increase to
the medical care ratio, which was primarily due to the initiation of premium rebate obligations in 2011, and lower favorable
reserve development levels.
In our Medicare Part D stand-alone business, we estimate that we entered January 2012 down approximately 625,000 people,
primarily as a result of the loss of approximately 470,000 of our auto-assigned low-income subsidy Medicare Part D
beneficiaries in a number of regions being automatically reassigned to other plans as part of the annual bid process managed by
CMS. We believe that we will grow from this level throughout the course of the year in the open retail market.
In February 2012, we added 117,000 Medicare Advantage members from the acquisition of XLHealth Corporation.
Optum. Total revenue for these businesses increased in 2011 due to business growth and acquisitions at OptumHealth and
OptumInsight and growth in customers served through pharmaceutical benefit management programs at OptumRx.
Optum’s operating margin for the year ended December 31, 2011 was down compared to 2010. The decrease was due to
changes in business mix within Optum’s businesses and realignment of certain internal business arrangements.
The results by segment were as follows:
OptumHealth
Increased revenues at OptumHealth for the year ended December 31, 2011 were primarily due to expansions in service
offerings through acquisitions in clinical services, as well as growth in consumer and population health management offerings.
Earnings from operations for the year ended December 31, 2011 and operating margin decreased compared to 2010. The
decreases reflect the impact from internal business and service arrangement realignments and the mix effect of growth and
expansion in newer businesses such as clinical services.
OptumInsight
Increased revenues at OptumInsight for the year ended December 31, 2011 were due to the impact of organic growth and the
full-year impact of 2010 acquisitions, which were partially offset by the divestiture of the clinical trials services business in
June 2011.
The increases in earnings from operations and operating margins for the year ended December 31, 2011 reflect an increased
mix of higher margin services in 2011 as well as the effect on 2010 earnings from operations and operating margin of the
goodwill impairment and charges for a business line disposition of certain i3-branded clinical trial service businesses. See Note
6 of Notes to the Consolidated Financial Statements for further detail on the goodwill impairment.