Under Armour 2005 Annual Report Download - page 51
Download and view the complete annual report
Please find page 51 of the 2005 Under Armour annual report below. You can navigate through the pages in the report by either clicking on the pages listed below, or by using the keyword search tool below to find specific information within the annual report.-
 1
1 -
2
-
3
-
4
-
5
-
6
-
7
-
8
-
9
-
10
-
11
-
12
-
13
-
14
-
15
-
16
-
17
-
18
-
19
-
20
-
21
-
22
-
23
-
24
-
25
-
26
-
27
-
28
-
29
-
30
-
31
-
32
-
33
-
34
-
35
-
36
-
37
-
38
-
39
-
40
-
 41
41 -
 42
42 -
 43
43 -
 44
44 -
 45
45 -
 46
46 -
 47
47 -
 48
48 -
 49
49 -
 50
50 -
 51
51 -
 52
52 -
 53
53 -
 54
54 -
 55
55 -
 56
56 -
 57
57 -
 58
58 -
 59
59 -
 60
60 -
 61
61 -
62
-
63
-
64
-
65
-
66
-
67
-
68
-
69
-
70
-
71
-
72
-
73
-
74
 |
 |

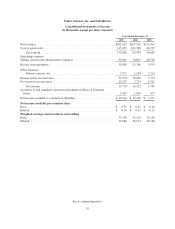
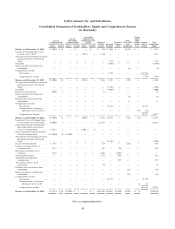
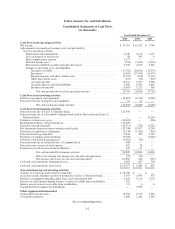
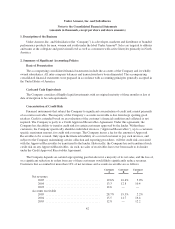
Under Armour, Inc. and Subsidiaries
Notes to the Consolidated Financial Statements—(Continued)
(amounts in thousands, except per share and share amounts)
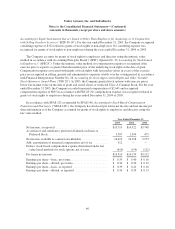
advertising costs include sponsorship expenses. Accounting for sponsorship payments is based upon specific
contract provisions. Generally, sponsorship payments are expensed uniformly over the term of the contract after
giving recognition to periodic performance compliance provisions of the contracts. Prepayments made under
contracts are included in prepaid expenses and other current assets. Advertising expense was $30,465, $21,753
and $13,728 for the years ended December 31, 2005, 2004 and 2003, respectively. At December 31, 2004,
prepaid advertising costs were $279. No amounts were prepaid as of December 31, 2005.
Shipping and Handling Costs
The Company charges certain customers shipping and handling fees. These revenues are recorded in net
revenues. The costs associated with shipping goods to customers from our distribution center are recorded in
selling, general and administrative expenses. For the years ended December 31, 2005, 2004 and 2003, these
shipping costs were $3,590, $1,667 and $1,533, respectively.
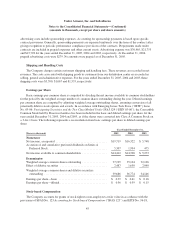
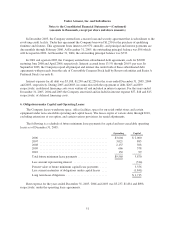
Earnings per Share
Basic earnings per common share is computed by dividing the net income available to common stockholders
for the period by the weighted average number of common shares outstanding during the year. Diluted earnings
per common share are computed by adjusting weighted average outstanding shares, assuming conversion of all
potentially dilutive stock options and awards. In accordance with Emerging Issues Task Force (“EITF”) Issue
No. 03-06: Participating Securities and the Two Class Method Under SFAS 128 (“EITF 03-06”), the Convertible
Common Stock held by Rosewood entities has been included in the basic and diluted earnings per share for the
years ended December 31, 2005, 2004 and 2003, as if the shares were converted into Class A Common Stock on
a 3-for-1 basis. The following represents a reconciliation from basic earnings per share to diluted earnings per
share:
Year Ended December 31,
Shares in thousands 2005 2004 2003
Numerator
Net income, as reported ................................... $19,719 $16,322 $ 5,748
Accretion of and cumulative preferred dividends on Series A
Preferred Stock ........................................ 5,307 1,994 475
Net income available to common shareholders ................. $14,412 $14,328 $ 5,273
Denominator
Weighted average common shares outstanding ................. 37,199 35,124 32,106
Effect of dilutive securities ................................ 2,487 1,650 2,040
Weighted average common shares and dilutive securities
outstanding ........................................... 39,686 36,774 34,146
Earnings per share—basic ................................. $ 0.39 $ 0.41 $ 0.16
Earnings per share—diluted ................................ $ 0.36 $ 0.39 $ 0.15
Stock-based Compensation
The Company accounts for grants of stock rights to non-employees at fair value in accordance with the
provisions of SFAS No. 123 Accounting for Stock-based Compensation (“SFAS 123”) and EITF No. 96-18,
45