Under Armour 2005 Annual Report Download - page 33
Download and view the complete annual report
Please find page 33 of the 2005 Under Armour annual report below. You can navigate through the pages in the report by either clicking on the pages listed below, or by using the keyword search tool below to find specific information within the annual report.-
 1
1 -
2
-
3
-
4
-
5
-
6
-
7
-
8
-
9
-
10
-
11
-
12
-
13
-
14
-
15
-
16
-
17
-
18
-
19
-
20
-
21
-
22
-
 23
23 -
 24
24 -
 25
25 -
 26
26 -
 27
27 -
 28
28 -
 29
29 -
 30
30 -
 31
31 -
 32
32 -
 33
33 -
 34
34 -
 35
35 -
 36
36 -
 37
37 -
 38
38 -
 39
39 -
 40
40 -
 41
41 -
 42
42 -
 43
43 -
44
-
45
-
46
-
47
-
48
-
49
-
50
-
51
-
52
-
53
-
54
-
55
-
56
-
57
-
58
-
59
-
60
-
61
-
62
-
63
-
64
-
65
-
66
-
67
-
68
-
69
-
70
-
71
-
72
-
73
-
74
 |
 |

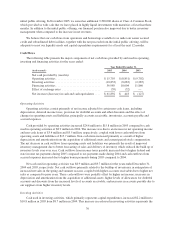
• Selling costs increased $5.4 million to $17.1 million in 2005 from $11.7 million in 2004. This increase
was due to increased headcount in our sales force and startup costs associated with our international
growth initiatives. As a percentage of net revenues, selling costs increased to 6.1% in 2005 from 5.7% in
2004 due to the increased costs described above.
• Payroll and related costs (excluding those specifically related to marketing and selling) increased $8.6
million to $26.9 million in 2005, from $18.3 million in 2004. The increase during 2005 was due to the
following initiatives: we began to build our team to design and source our footwear line, which we
expect to offer for the fall 2006 season, we added personnel to our information technology team to
support our Company-wide initiative to upgrade our information systems, we incurred equity
compensation costs, we added personnel to operate our 3 new retail outlet stores, and we invested in the
personnel needed to enhance our compliance function and operate as a public company. As a percentage
of net revenues, payroll and related costs (excluding those specifically related to marketing and selling)
increased to 9.6% in 2005 from 8.9% in 2004 due to the items described above.
• Other corporate costs increased $7.2 million to $25.5 million in 2005, from $18.3 million in 2004. This
increase was attributable to higher costs in support of our footwear initiative, freight and duty related to
increased Canada sales, expansion of our leased corporate office space and distribution facility, and
necessary costs associated with being a public company. As a percentage of net revenues, other
corporate costs were 9.1% in 2005, which is a slight increase from 8.9% in 2004 due to the items noted
above.
Income from operations increased $10.5 million, or 41.4%, to $35.9 million in 2005 from $25.4 million in
2004. Income from operations as a percentage of net revenues increased to 12.7% in 2005 from 12.4% in 2004.
This increase was a result of an increase in gross margin partially offset by an increase in selling, general and
administrative expenses as a percentage of net revenues.
Interest expense, net increased $1.6 million to $2.9 million in 2005 from $1.3 million in 2004. This increase
was primarily due to higher average borrowings and a higher effective interest rate under our revolving credit
facility prior to being repaid in November 2005 with proceeds from the initial public offering.
Provision for income taxes increased $5.5 million to $13.3 million in 2005 from $7.8 million in 2004. For
the year ended December 31, 2005 our effective tax rate was 40.2% compared to 32.3% in 2004. This increase
was primarily due to an increase in our effective state tax rate, which reflected reduced state tax credits earned as
a percentage of income before taxes.
Net income increased $3.4 million to $19.7 million in 2005 from $16.3 million in 2004, as a result of the
factors described above.
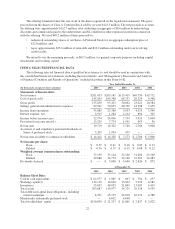
Year Ended December 31, 2004 Compared to Year Ended December 31, 2003
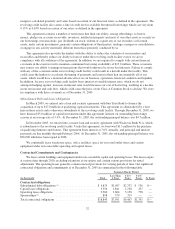
Net revenues increased $89.8 million, or 77.8%, to $205.2 million in 2004 from $115.4 million in 2003. The
increase was a result of increases in both our net sales and license revenues as noted in the product category table
below.
Year Ended December 31,
(In thousands) 2004 2003 $ Change % Change
Mens ...................................... $151,962 $ 92,197 $59,765 64.8%
Womens ................................... 28,659 10,968 17,691 161.3%
Youth ..................................... 12,705 8,518 4,187 49.2%
Accessories ................................ 7,548 2,072 5,476 264.3%
Total net sales .......................... 200,874 113,755 87,119 76.6%
License revenues ............................ 4,307 1,664 2,643 158.8%
Total net revenues ....................... $205,181 $115,419 $89,762 77.8%
27