Under Armour 2005 Annual Report Download - page 47
Download and view the complete annual report
Please find page 47 of the 2005 Under Armour annual report below. You can navigate through the pages in the report by either clicking on the pages listed below, or by using the keyword search tool below to find specific information within the annual report.-
 1
1 -
2
-
3
-
4
-
5
-
6
-
7
-
8
-
9
-
10
-
11
-
12
-
13
-
14
-
15
-
16
-
17
-
18
-
19
-
20
-
21
-
22
-
23
-
24
-
25
-
26
-
27
-
28
-
29
-
30
-
31
-
32
-
33
-
34
-
35
-
36
-
 37
37 -
 38
38 -
 39
39 -
 40
40 -
 41
41 -
 42
42 -
 43
43 -
 44
44 -
 45
45 -
 46
46 -
 47
47 -
 48
48 -
 49
49 -
 50
50 -
 51
51 -
 52
52 -
 53
53 -
 54
54 -
 55
55 -
 56
56 -
 57
57 -
58
-
59
-
60
-
61
-
62
-
63
-
64
-
65
-
66
-
67
-
68
-
69
-
70
-
71
-
72
-
73
-
74
 |
 |

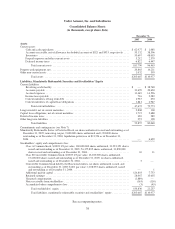
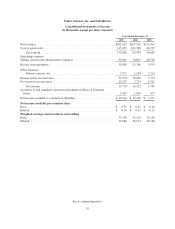
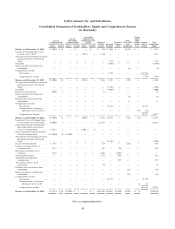
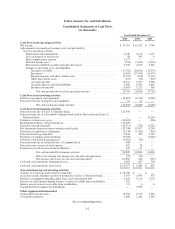
Under Armour, Inc. and Subsidiaries
Consolidated Statements of Cash Flows
(in thousands)
Year Ended December 31,
2005 2004 2003
Cash flows from operating activities
Net income ............................................................... $ 19,719 $ 16,322 $ 5,748
Adjustments to reconcile net income to net cash provided by
(used in) operating activities
Depreciation and amortization ............................................ 6,546 3,174 1,171
Loss on disposal of fixed assets ........................................... 58 591 8
Stock compensation expense ............................................. 1,177 — —
Deferred income taxes .................................................. (331) (3,341) (1,918)
Provision for doubtful accounts and other allowances .......................... 3,150 4,610 6,361
Changes in operating assets and liabilities:
Accounts receivable ................................................ (17,552) (18,811) (15,579)
Inventories ....................................................... (5,669) (27,195) (10,679)
Prepaid expenses and other current assets ............................... (2,723) (615) (1,111)
Other non-current assets ............................................. (157) (69) (310)
Accounts payable .................................................. 11,074 9,747 3,358
Accrued expenses and other liabilities .................................. 1,990 5,504 2,691
Income taxes payable ............................................... (1,487) 1,232 558
Net cash provided by (used in) operating activities .................... 15,795 (8,851) (9,702)
Cash flows from investing activities
Purchase of property and equipment ........................................... (10,887) (8,724) (2,285)
Proceeds from sale of property and equipment ................................... 54 41 —
Net cash used in investing activities ................................ (10,833) (8,683) (2,285)
Cash flows from financing activities
Proceeds from sale of Class A Common Stock ................................... 123,500 — —
Proceeds from sale of Convertible Common Stock held by Rosewood and Series A
Preferred Stock .......................................................... — — 12,000
Payments of stock issue costs ................................................. (10,824) — (366)
Redemption of Series A Preferred Stock ........................................ (12,000) — —
Payments on long-term debt .................................................. (26,711) (524) (6,011)
Net (payments) proceeds from revolving credit facility ............................. (13,748) 19,457 8,250
Payments on capital lease obligations .......................................... (2,330) (1,424) (518)
Proceeds from long-term debt ................................................ 3,944 450 2,145
Payments of common stock dividends .......................................... (5,000) — (3,640)
Payments of deferred financing costs ........................................... (1,061) (50) —
Proceeds from sale of restricted Class A Common Stock ........................... 498 — —
Proceeds from exercise of stock options ........................................ 492 78 —
Payments received on notes from stockholders ................................... 229 17 —
Net cash provided by financing activities ............................ 56,989 18,004 11,860
Effect of exchange rate changes on cash and cash equivalents ........... (59) (52) —
Net increase (decrease) in cash and cash equivalents ................... 61,892 418 (127)
Cash and cash equivalents beginning of year ..................................... 1,085 667 794
Cash and cash equivalents end of year .......................................... $ 62,977 $ 1,085 $ 667
Non-cash financing and investing activities
Transfer of revolving credit facility to term debt .................................. $ 25,000 $ — $ —
Accretion of and cumulative preferred dividends on Series A Preferred Stock ........... 5,307 1,994 475
Purchase of equipment through capital leases and subordinated debt .................. 2,103 5,156 1,176
Exercise of stock options though issuance of notes receivable from stockholders ........ 262 — —
Interest earned on notes receivable from stockholders .............................. 12 6 6
Unpaid declared common stock dividends ....................................... — 5,000 —
Other supplemental information
Cash paid for income taxes ................................................... 15,204 9,775 3,350
Cash paid for interest ....................................................... 2,866 1,281 2,365
See accompanying notes.
41