Under Armour 2005 Annual Report Download - page 34
Download and view the complete annual report
Please find page 34 of the 2005 Under Armour annual report below. You can navigate through the pages in the report by either clicking on the pages listed below, or by using the keyword search tool below to find specific information within the annual report.-
 1
1 -
2
-
3
-
4
-
5
-
6
-
7
-
8
-
9
-
10
-
11
-
12
-
13
-
14
-
15
-
16
-
17
-
18
-
19
-
20
-
21
-
22
-
23
-
 24
24 -
 25
25 -
 26
26 -
 27
27 -
 28
28 -
 29
29 -
 30
30 -
 31
31 -
 32
32 -
 33
33 -
 34
34 -
 35
35 -
 36
36 -
 37
37 -
 38
38 -
 39
39 -
 40
40 -
 41
41 -
 42
42 -
 43
43 -
 44
44 -
45
-
46
-
47
-
48
-
49
-
50
-
51
-
52
-
53
-
54
-
55
-
56
-
57
-
58
-
59
-
60
-
61
-
62
-
63
-
64
-
65
-
66
-
67
-
68
-
69
-
70
-
71
-
72
-
73
-
74
 |
 |
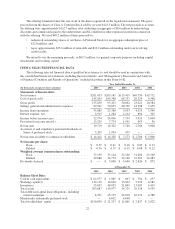
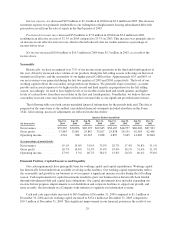
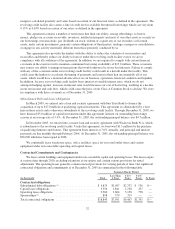
Net sales increased $87.1 million, or 76.6%, to $200.9 million in 2004 from $113.8 million in 2003 as noted
in the table above. The increases in mens, womens and youth product categories noted above primarily reflect:
• unit volume growth driven largely by increased sales to the military and law enforcement as well as
increased sales in Canada, while the pricing of our existing products remained relatively unchanged; and
• the introduction of new products, including men’s compression and running shorts, a line of men’s
fleece, athletic gloves, a women’s sports bra and women’s seamless underwear. These new products
collectively accounted for $17.1 million of the increase in net sales.
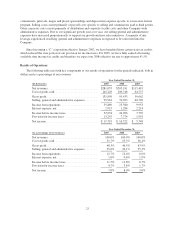
License revenues increased $2.6 million to $4.3 million in 2004 from $1.7 million in 2003. The increase in
license revenues was primarily a result of increased sales by our domestic licensees.
Gross profit increased $44.7 million to $95.4 million in 2004 from $50.7 million in 2003. Gross profit as a
percentage of net revenues, or gross margin, increased 260 basis points to 46.5% in 2004 from 43.9% in 2003.
This net increase in gross margin was primarily driven by the following:
• a 200 basis point increase due to more accurate demand forecasting and better inventory management;
• a 100 basis point increase due to lower costs paid to our overseas manufacturers for our products as a
result of volume discounts;
• a 30 basis point increase related to the $2.6 million increase in license revenues; and
• a 40 basis point decrease due to higher overhead costs associated with our quick-turn, Special Make-Up
Shop.
Selling, general and administrative expenses increased $29.4 million, or 72.1%, to $70.1 million in 2004
from $40.7 million in 2003. As a percentage of net revenues, selling, general and administrative expenses
decreased to 34.1% in 2004 from 35.3% in 2003. This net increase was primarily driven by the following:
• Marketing costs increased $8.1 million to $21.8 million in 2004 from $13.7 million in 2003. The
increase was attributable to higher headcount, along with increased depreciation expense related to our
in-store fixture program. Marketing costs as a percentage of net revenues decreased to 10.6% of net
revenues in 2004 from 11.9% in 2003 as we were able to leverage these costs with our growth in
revenues.
• Selling costs increased $5.1 million to $11.7 million in 2004 from $6.6 million in 2003. The increase in
selling costs was attributable to increased headcount and sales commissions. As a percentage of net
revenues, selling costs stayed consistent at 5.7% in 2004 and 2003.
• Payroll and related costs (excluding those specifically related to marketing and selling) increased $7.5
million to $18.3 million in 2004 from $10.8 million in 2003. The increase was attributable to an increase
in headcount to support our growth. As a percentage of net revenues, payroll and related costs
(excluding those specifically related to marketing and selling) decreased to 8.9% in 2004 from 9.4% in
2003 as we were able to experience leverage from our growth in net revenues during 2004.
• Other corporate costs increased $8.7 million to $18.3 million in 2004 from $9.6 million in 2003. This
increase was due to increased distribution and corporate facility costs to support our growth. Due to
these increased costs, as a percentage of net revenues, other corporate costs increased to 8.9% in 2004
from 8.3% in 2003.
Income from operations increased $15.4 million, or 155.0%, to $25.4 million in 2004 from $10.0 million in
2003. Income from operations as a percentage of net revenues increased to 12.4% in 2004 from 8.6% in 2003.
This increase was a result of the increase in gross margin and a decrease in selling, general and administrative
expenses as a percentage of net revenues for the year as noted above.
28