Under Armour 2005 Annual Report Download - page 35
Download and view the complete annual report
Please find page 35 of the 2005 Under Armour annual report below. You can navigate through the pages in the report by either clicking on the pages listed below, or by using the keyword search tool below to find specific information within the annual report.-
 1
1 -
2
-
3
-
4
-
5
-
6
-
7
-
8
-
9
-
10
-
11
-
12
-
13
-
14
-
15
-
16
-
17
-
18
-
19
-
20
-
21
-
22
-
23
-
24
-
 25
25 -
 26
26 -
 27
27 -
 28
28 -
 29
29 -
 30
30 -
 31
31 -
 32
32 -
 33
33 -
 34
34 -
 35
35 -
 36
36 -
 37
37 -
 38
38 -
 39
39 -
 40
40 -
 41
41 -
 42
42 -
 43
43 -
 44
44 -
 45
45 -
46
-
47
-
48
-
49
-
50
-
51
-
52
-
53
-
54
-
55
-
56
-
57
-
58
-
59
-
60
-
61
-
62
-
63
-
64
-
65
-
66
-
67
-
68
-
69
-
70
-
71
-
72
-
73
-
74
 |
 |

Interest expense, net decreased $0.9 million to $1.3 million in 2004 from $2.2 million in 2003. The decrease
in interest expense was primarily attributable to our redemption of high-interest bearing subordinated debt with
proceeds received from the sale of equity in the third quarter of 2003.
Provision for income taxes increased $5.8 million to $7.8 million in 2004 from $2.0 million in 2003,
resulting in an effective tax rate of 32.3% in 2004 compared to 25.7% in 2003. This increase was primarily due to
an increase in our effective state tax rate, which reflected reduced state tax credits earned as a percentage of
income before taxes.
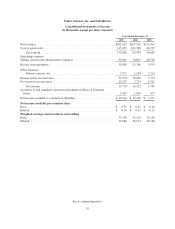
Net income increased $10.6 million to $16.3 million in 2004 from $5.7 million in 2003, as a result of the
factors above.
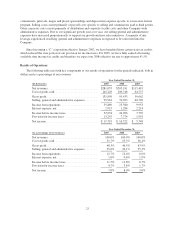
Seasonality
Historically, we have recognized over 75% of our income from operations in the third and fourth quarters of
the year, driven by increased sales volume of our products during the fall selling season, reflecting our historical
strength in fall sports, and the seasonality of our higher priced ColdGear line. Approximately 62% and 66% of
our net revenues were generated during the last two quarters of 2005 and 2004, respectively. The level of our
working capital reflects the seasonality and growth in our business. We generally expect inventory, accounts
payable and accrued expenses to be higher in the second and third quarters in preparation for the fall selling
season. Accordingly, we tend to have higher levels of receivables in the third and fourth quarters and higher
levels of cash in-flows from these receivables in the first and fourth quarters. Nonetheless, we believe that our
seasonality in recent years may have been somewhat overstated due to our significant growth in net revenues.
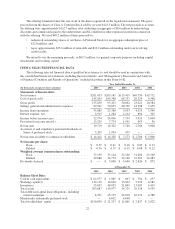
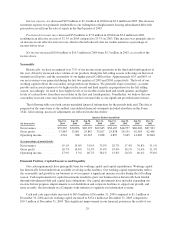
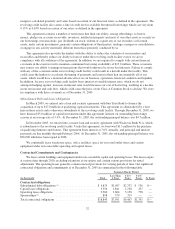
The following table sets forth certain unaudited financial information for the periods indicated. The data is
prepared on the same basis as the audited consolidated financial statements included elsewhere in this Form
10-K. All recurring, necessary adjustments are reflected in the data below.
Quarter Ended (unaudited)
(In thousands)
Mar 31,
2004
Jun 30,
2004
Sep 30,
2004
Dec 31,
2004
Mar 31,
2005
Jun 30,
2005
Sep 30,
2005
Dec 31,
2005
Net revenues ............ $39,267 $30,876 $65,393 $69,645 $58,187 $48,957 $86,606 $87,303
Gross profit ............. 17,883 13,891 29,842 33,817 25,838 24,551 42,965 42,496
Operating income ........ 4,541 828 10,343 9,668 4,897 3,645 14,483 12,864
(As a percentage of annual totals)
Net revenues ............ 19.1% 15.0% 31.9% 33.9% 20.7% 17.4% 30.8% 31.1%
Gross profit ............. 18.7% 14.6% 31.3% 35.4% 19.0% 18.1% 31.6% 31.3%
Operating income ........ 17.9% 3.3% 40.7% 38.1% 13.6% 10.2% 40.4% 35.8%
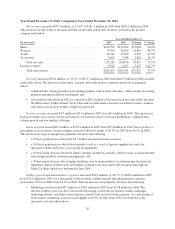
Financial Position, Capital Resources and Liquidity
Our cash requirements have principally been for working capital and capital expenditures. Working capital
has historically been funded from available revolving credit facilities. Our working capital requirements reflect
the seasonality and growth in our business as we recognize a significant increase in sales during the fall selling
season. Cash requirements for capital investments needed to grow our business have historically been funded
through subordinated debt and capital lease obligations. Our capital investments have included expanding our
in-store fixture program, improvements to our distribution and corporate facilities to support our growth, and
more recently, the investment in a Company-wide initiative to upgrade our information systems.
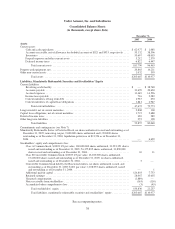
Cash and cash equivalents increased to $63.0 million at December 31, 2005 compared to $1.1 million at
December 31, 2004 and our working capital increased to $134.1 million at December 31, 2005 compared to
$16.7 million at December 31, 2004. This significant improvement in our financial position is the result of our
29