Under Armour 2005 Annual Report Download - page 36
Download and view the complete annual report
Please find page 36 of the 2005 Under Armour annual report below. You can navigate through the pages in the report by either clicking on the pages listed below, or by using the keyword search tool below to find specific information within the annual report.-
 1
1 -
2
-
3
-
4
-
5
-
6
-
7
-
8
-
9
-
10
-
11
-
12
-
13
-
14
-
15
-
16
-
17
-
18
-
19
-
20
-
21
-
22
-
23
-
24
-
25
-
 26
26 -
 27
27 -
 28
28 -
 29
29 -
 30
30 -
 31
31 -
 32
32 -
 33
33 -
 34
34 -
 35
35 -
 36
36 -
 37
37 -
 38
38 -
 39
39 -
 40
40 -
 41
41 -
 42
42 -
 43
43 -
 44
44 -
 45
45 -
 46
46 -
47
-
48
-
49
-
50
-
51
-
52
-
53
-
54
-
55
-
56
-
57
-
58
-
59
-
60
-
61
-
62
-
63
-
64
-
65
-
66
-
67
-
68
-
69
-
70
-
71
-
72
-
73
-
74
 |
 |

initial public offering. In November 2005, we issued an additional 9,500,000 shares of Class A Common Stock,
which provided us with cash that we have placed in highly liquid investments with maturities of less than three
months. In addition to the initial public offering, our financial position also improved due to better inventory
management when compared to the increase in net revenues.
We believe that our cash flows from operations and borrowings available to us under our senior secured
credit and subordinated debt facilities, together with the net proceeds from the initial public offering, will be
adequate to meet our liquidity needs and capital expenditure requirements for at least the next 12 months.
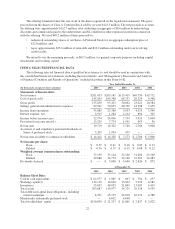
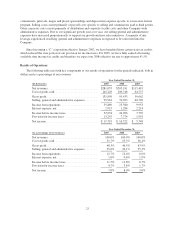
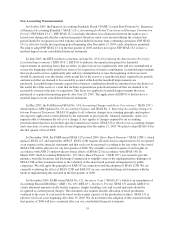
Cash Flows
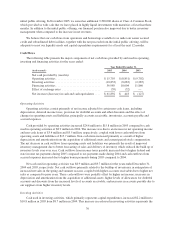
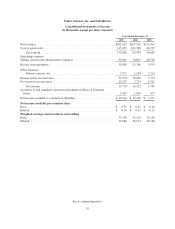
The following table presents the major components of net cash flows provided by and used in operating,
investing and financing activities for the years ended:
Year Ended December 31,
(in thousands) 2005 2004 2003
Net cash provided by (used in):
Operating activities .............................. $15,795 $ (8,851) $ (9,702)
Investing activities .............................. (10,833) (8,683) (2,285)
Financing activities .............................. 56,989 18,004 11,860
Effect of exchange rates .......................... (59) (52) —
Net increase (decrease) in cash and cash equivalents .... $61,892 $ 418 $ (127)
Operating Activities
Operating activities consist primarily of net income adjusted for certain non-cash items, including
depreciation, deferred income taxes, provision for doubtful accounts and other discounts and the effect of
changes in operating assets and liabilities, principally accounts receivable, inventories, accounts payable and
accrued expenses.
Cash provided by operating activities increased $24.6 million to $15.8 million in 2005 compared to cash
used in operating activities of $8.9 million in 2004. The increase was due to an increase in net operating income
and non-cash items of $3.4 million and $5.5 million, respectively, coupled with lower cash outflows from
operating assets and liabilities of $15.7 million. Non-cash items increased primarily as a result of higher
depreciation and amortization from the acquisition of additional assets and current period stock compensation.
The net decrease in cash outflows from operating assets and liabilities was primarily the result of improved
inventory management due to better forecasting of sales and delivery of inventory which reduced the build up of
inventory levels year over year. Cash outflows from income taxes payable increased due to higher federal and
state income tax payments during 2005 compared to tax payments made during 2004 and cash outflows from
accrued expenses increased due to higher bonus payments during 2005 compared to 2004.
Net cash used in operating activities was $8.9 million and $9.7 million for the years ended December 31,
2004 and 2003, respectively. Net cash outflows primarily related to the buildup of inventories in anticipation of
increased net sales in the spring and summer seasons, coupled with higher accounts receivable due to higher net
sales as compared to prior years. These cash outflows were partially offset by higher net income; increases in
depreciation and amortization from the acquisition of additional assets; higher levels of allowances for doubtful
accounts and discounts from the increased levels of accounts receivable; and increases in accounts payable due to
our suppliers from higher inventory levels.
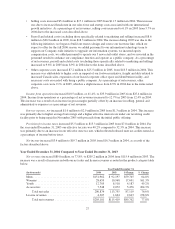
Investing Activities
Cash used in investing activities, which primarily represents capital expenditures, increased $2.2 million to
$10.8 million in 2005 from $8.7 million in 2004. This increase in cash used in investing activities represents the
30