TomTom 2010 Annual Report Download - page 88
Download and view the complete annual report
Please find page 88 of the 2010 TomTom annual report below. You can navigate through the pages in the report by either clicking on the pages listed below, or by using the keyword search tool below to find specific information within the annual report.-
 1
1 -
2
-
3
-
4
-
5
-
6
-
7
-
8
-
9
-
10
-
11
-
12
-
13
-
14
-
15
-
16
-
17
-
18
-
19
-
20
-
21
-
22
-
23
-
24
-
25
-
26
-
27
-
28
-
29
-
30
-
31
-
32
-
33
-
34
-
35
-
36
-
37
-
38
-
39
-
40
-
41
-
42
-
43
-
44
-
45
-
46
-
47
-
48
-
49
-
50
-
51
-
52
-
53
-
54
-
55
-
56
-
57
-
58
-
59
-
60
-
61
-
62
-
63
-
64
-
65
-
66
-
67
-
68
-
69
-
70
-
71
-
72
-
73
-
74
-
75
-
76
-
77
-
 78
78 -
 79
79 -
 80
80 -
 81
81 -
 82
82 -
 83
83 -
 84
84 -
 85
85 -
 86
86 -
 87
87 -
 88
88 -
 89
89 -
 90
90 -
 91
91 -
 92
92 -
 93
93 -
 94
94 -
 95
95 -
 96
96 -
 97
97 -
 98
98 -
99
-
100
 |
 |
p 86 / TomTom Annual Report and Accounts 2010
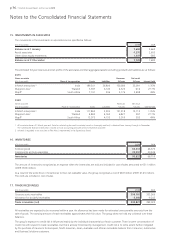
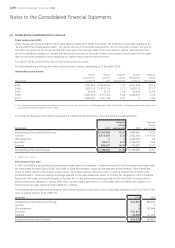
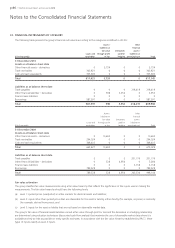
33. FINANCIAL INSTRUMENTS BY CATEGORY
The following table presents the group’s financial instruments according to the categories as defined in IAS 39:
Assets / Other
liabilities at financial
fair value Derivatives assets /
Loans and through profit used for liabilities at
(€ in thousands) receivables or loss hedging amortised cost Total
31 December 2010
Assets as at balance sheet date
Other financial assets – derivatives 0 5,724 0 0 5,724
Trade receivables 305,821 0 0 0 305,821
Cash and cash equivalents 305,600 0 0 0 305,600
Total 611,421 5,724 0 0 617,145
Liabilities as at balance sheet date
Trade payables 0 0 0 218,419 218,419
Other financial liabilities – derivatives 0 598 3,354 0 3,952
Finance lease liabilities 0 0 0 0 0
Borrowings 587,597 0 0 0 587,597
Total 587,597 598 3,354 218,419 809,968
Assets / Other
liabilities at financial
fair value Derivatives assets /
Loans and through profit used for liabilities at
(€ in thousands) receivables or loss hedging amortised cost Total
31 December 2009
Assets as at balance sheet date
Other financial assets – derivatives 0 10,602 0 0 10,602
Trade receivables 294,024 0 0 0 294,024
Cash and cash equivalents 368,403 0 0 0 368,403
Total 662,427 10,602 0 0 673,029
Liabilities as at balance sheet date
Trade payables 0 0 0 201,176 201,176
Other financial liabilities – derivatives 0 328 4,956 0 5,284
Finance lease liabilities 0 0 0 2,158 2,158
Borrowings 789,528 0 0 0 789,528
Total 789,528 328 4,956 203,334 998,146
Fair value estimation
The group classifies fair value measurements using a fair value hierarchy that reflects the significance of the inputs used in making the
measurements. The fair value hierarchy should have the following levels:
(a) Level 1: quoted prices (unadjusted) in active markets for identical assets and liabilities;
(b) Level 2: inputs other than quoted prices that are observable for the asset or liability, either directly (for example, as prices) or indirectly
(for example, derived from prices); and
(c) Level 3: inputs for the asset or liability that are not based on observable market data.
The group’s fair value of financial assets/liabilities carried at fair value through profit or loss and the derivatives in a hedging relationship
are determined using valuation techniques (discounted cash flow analysis) that maximise the use of observable market data where it is
available and rely as little as possible on entity specific estimates. In accordance with the fair value hierarchy established by IFRS 7, these
types of inputs classify as Level 2 inputs.
Notes to the Consolidated Financial Statements