TomTom 2010 Annual Report Download - page 76
Download and view the complete annual report
Please find page 76 of the 2010 TomTom annual report below. You can navigate through the pages in the report by either clicking on the pages listed below, or by using the keyword search tool below to find specific information within the annual report.-
 1
1 -
2
-
3
-
4
-
5
-
6
-
7
-
8
-
9
-
10
-
11
-
12
-
13
-
14
-
15
-
16
-
17
-
18
-
19
-
20
-
21
-
22
-
23
-
24
-
25
-
26
-
27
-
28
-
29
-
30
-
31
-
32
-
33
-
34
-
35
-
36
-
37
-
38
-
39
-
40
-
41
-
42
-
43
-
44
-
45
-
46
-
47
-
48
-
49
-
50
-
51
-
52
-
53
-
54
-
55
-
56
-
57
-
58
-
59
-
60
-
61
-
62
-
63
-
64
-
65
-
 66
66 -
 67
67 -
 68
68 -
 69
69 -
 70
70 -
 71
71 -
 72
72 -
 73
73 -
 74
74 -
 75
75 -
 76
76 -
 77
77 -
 78
78 -
 79
79 -
 80
80 -
 81
81 -
 82
82 -
 83
83 -
 84
84 -
 85
85 -
 86
86 -
87
-
88
-
89
-
90
-
91
-
92
-
93
-
94
-
95
-
96
-
97
-
98
-
99
-
100
 |
 |
p 74 / TomTom Annual Report and Accounts 2010
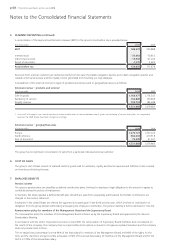
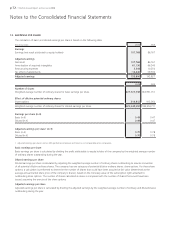
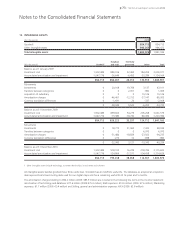
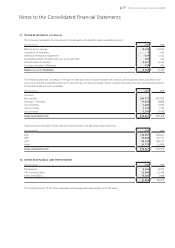
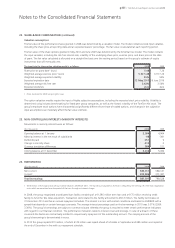
13. INTANGIBLE ASSETS (continued)
Impairment test for goodwill
Goodwill is allocated to the group’s cash generating units (CGUs) identified according to the core business activities as monitored by
management. In accordance with the amendment to IAS 36 “Impairment of assets” and due to internal change in group structure the
goodwill has been reallocated to each of the operating segments defined in accordance with IFRS 8 “Operating segments”. The goodwill
impairment test has been performed for each of these operating segments based on the revised allocation.
A segment-level summary of the goodwill allocation for our segments in 2010 and 2009 is presented below.
(€ in thousands) 2010
Consumer 641,831
Automotive 83,389
Licensing 85,217
Business Solutions 44,276
854,713
(€ in thousands) 2009
TomTom 710,584
Tele Atlas 144,129
Total 854,713
The recoverable amount of a CGU is determined based on the higher of the value in use or fair value less cost to sell calculations. The fair
value less cost to sell resulted in a higher recoverable amount.
These calculations use post-tax cash flow projections based on financial forecasts approved by management covering a three year period.
Management considered the effects of applying a pre-tax approach and concluded that this will not materially change the outcome of the
impairment test. Cash flows beyond the three year period are extrapolated using the estimated growth rates.
Management determined budget revenues based on past performance and its expectation of market development. Discount rates used
are post-tax and reflect specific risks relating to the relevant operating segments.
Management expectations and other input to the calculation such as discount rate, market size and market shares reflect the current
economic climate and market developments relevant to the segments. Insofar possible, our expectations and input to the impairment
calculation have been cross checked with the available external information from various analysts.
The calculated fair value less costs to sell resulted in a recoverable amount that was higher than the carrying amount for all segments and
accordingly no impairment charge has been recorded in 2010 (2009: nil).
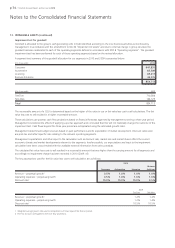
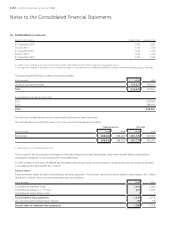
The key assumptions used for the fair value less cost to sell calculation are as follows:
2010
Business
Consumer Automotive Licensing Solutions
Revenue – perpetual growth1 0.5% 1.8% 1.0% 1.0%
Operating expenses – perpetual growth1 0.5% 1.8% 1.0% 1.0%
Discount rate2 10.0% 10.0% 10.0% 9.5%
2009
TomTom Tele Atlas
Revenue – perpetual growth1 1.2% 1.4%
Operating expenses – perpetual growth1 1.2% 1.4%
Discount rate2 10.5% 10.5%
1 Weighted average growth rate used to extrapolate cash flows beyond the forecast period.
2 Post-tax discount rate applied to the cash flow projections.
Notes to the Consolidated Financial Statements