TomTom 2010 Annual Report Download - page 70
Download and view the complete annual report
Please find page 70 of the 2010 TomTom annual report below. You can navigate through the pages in the report by either clicking on the pages listed below, or by using the keyword search tool below to find specific information within the annual report.-
 1
1 -
2
-
3
-
4
-
5
-
6
-
7
-
8
-
9
-
10
-
11
-
12
-
13
-
14
-
15
-
16
-
17
-
18
-
19
-
20
-
21
-
22
-
23
-
24
-
25
-
26
-
27
-
28
-
29
-
30
-
31
-
32
-
33
-
34
-
35
-
36
-
37
-
38
-
39
-
40
-
41
-
42
-
43
-
44
-
45
-
46
-
47
-
48
-
49
-
50
-
51
-
52
-
53
-
54
-
55
-
56
-
57
-
58
-
59
-
 60
60 -
 61
61 -
 62
62 -
 63
63 -
 64
64 -
 65
65 -
 66
66 -
 67
67 -
 68
68 -
 69
69 -
 70
70 -
 71
71 -
 72
72 -
 73
73 -
 74
74 -
 75
75 -
 76
76 -
 77
77 -
 78
78 -
 79
79 -
 80
80 -
81
-
82
-
83
-
84
-
85
-
86
-
87
-
88
-
89
-
90
-
91
-
92
-
93
-
94
-
95
-
96
-
97
-
98
-
99
-
100
 |
 |

p 68 / TomTom Annual Report and Accounts 2010
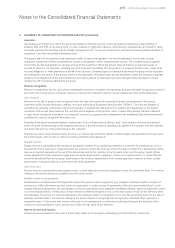
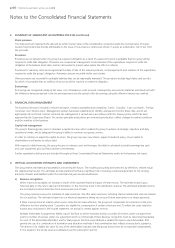
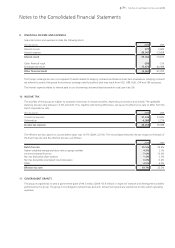
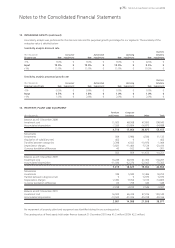
5. SEGMENT REPORTING (continued)
A reconciliation of the segments performance measure (EBIT) to the group’s result before tax is provided below.
(€ in thousands) 2010 2009
EBIT 186,322 220,888
Interest result -35,064 -70,815
Other finance result -15,962 -41,202
Result of associates -1,270 2,603
Result before tax 134,026 111,474
Revenues from external customers are derived primarily from the sale of portable navigation devices and in-dash navigation systems and
related content and services and the royalty income generated from licensing our map database.
A breakdown of the external revenue to types of products and services and to geographical areas is as follows:
External revenue – products and services1
(€ in thousands) 2010 2009
Sale of goods 1,164,477 1,174,543
Rendering of services 162,882 120,469
Royalty revenue 193,724 184,648
1,521,083 1,479,660
1 As a result of changes in our internal reporting structure a reallocation of revenue between sale of goods and rendering of services took place. For comparative
purposes the 2009 figures have been changed accordingly.
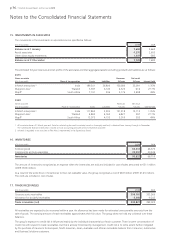
External revenue – geographical areas
(€ in thousands) 2010 2009
Europe 1,070,127 1,007,205
North America 380,463 410,918
Rest of the world 70,493 61,537
1,521,083 1,479,660
The group has no significant concentration of sales from a particular individual external customer.
6. COST OF SALES
The group’s cost of sales consists of material costs for goods sold to customers, royalty and license expenses and fulfilment costs incurred
on inventory sold during the year.
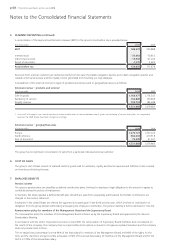
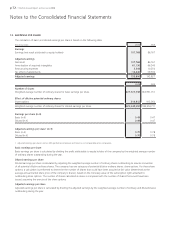
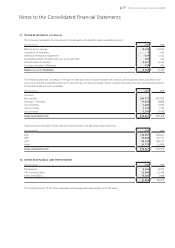
7. EMPLOYEE BENEFITS
Pension scheme
The group’s pension plans are classified as defined contribution plans, limiting the employer’s legal obligation to the amount it agrees to
contribute during the period of employment.
In Germany Tele Atlas operates a defined benefit plan. Benefits are paid from a separately administered fund whilst contributions are
charged to the income statement.
Employees in the United States are offered the opportunity to participate in the 401K pension plan, which involves no contribution or
obligation from the group besides withholding and paying the employee contribution. The pension liability is further disclosed in note 28.
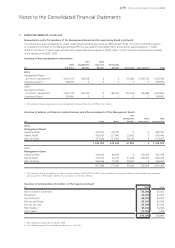
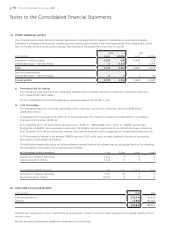
Remuneration policy for members of the Management Board and the Supervisory Board
The remuneration policy for members of the Management Board is drawn up by the Supervisory Board and approved by the General
Shareholders Meeting.
In accordance with the Dutch Corporate Governance Code 2009, the remuneration of Supervisory Board members does not depend on
the results of the company. The company does not grant either stock options or shares to its Supervisory Board members and the company
does not provide loans to them.
The on-target bonus percentage is set at 64% of the base salary for members of the Management Board and 80% of the salary for the
CEO, and the maximum annual incentive achievable is 96% of the annual base salary for members of the Management Board and for the
CEO it is 120% of the annual base salary.
Notes to the Consolidated Financial Statements