TomTom 2010 Annual Report Download - page 59
Download and view the complete annual report
Please find page 59 of the 2010 TomTom annual report below. You can navigate through the pages in the report by either clicking on the pages listed below, or by using the keyword search tool below to find specific information within the annual report.-
 1
1 -
2
-
3
-
4
-
5
-
6
-
7
-
8
-
9
-
10
-
11
-
12
-
13
-
14
-
15
-
16
-
17
-
18
-
19
-
20
-
21
-
22
-
23
-
24
-
25
-
26
-
27
-
28
-
29
-
30
-
31
-
32
-
33
-
34
-
35
-
36
-
37
-
38
-
39
-
40
-
41
-
42
-
43
-
44
-
45
-
46
-
47
-
48
-
 49
49 -
 50
50 -
 51
51 -
 52
52 -
 53
53 -
 54
54 -
 55
55 -
 56
56 -
 57
57 -
 58
58 -
 59
59 -
 60
60 -
 61
61 -
 62
62 -
 63
63 -
 64
64 -
 65
65 -
 66
66 -
 67
67 -
 68
68 -
 69
69 -
70
-
71
-
72
-
73
-
74
-
75
-
76
-
77
-
78
-
79
-
80
-
81
-
82
-
83
-
84
-
85
-
86
-
87
-
88
-
89
-
90
-
91
-
92
-
93
-
94
-
95
-
96
-
97
-
98
-
99
-
100
 |
 |

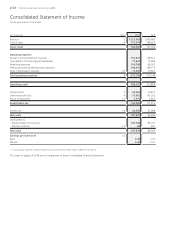
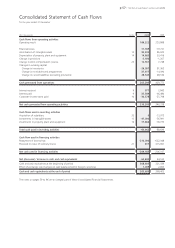
p 57 / TomTom Annual Report and Accounts 2010
Consolidated Statement of Cash Flows
for the year ended 31 December
(€ in thousands) Notes 2010 2009
Cash flows from operating activities
Operating result 186,322 220,888
Financial losses -11,789 -19,741
Amortisation of intangible assets 13 94,235 85,920
Depreciation of property, plant and equipment 14 14,863 20,416
Change in provisions -5,180 -1,267
Change in stock compensation reserve 22 12,901 7,748
Changes in working capital:
Change in inventories -26,987 81,363
Change in receivables and prepayments -27,617 -14,090
Change in current liabilities (excluding provisions) 28,545 48,536
Cash generated from operations 265,293 429,773
Interest received 9 977 2,843
Interest paid 9 -25,589 -66,480
Corporate income taxes paid 10 -30,378 -25,798
Net cash generated from operating activities 210,303 340,338
Cash flows used in investing activities
Acquisition of subsidiary 30 0 -13,973
Investments in intangible assets 13 -47,096 -56,991
Investments in property, plant and equipment 14 -17,866 -18,735
Total cash used in investing activities -64,962 -89,699
Cash flow used in financing activities
Repayment of borrowings -210,000 -622,048
Proceeds on issue of ordinary shares 21 817 415,941
Net cash used in financing activities -209,183 -206,107
Net (decrease) / increase in cash and cash equivalents -63,842 44,532
Cash and cash equivalents at the beginning of period 368,403 321,039
Effect of exchange rate changes on cash balances held in foreign currencies 1,039 2,832
Cash and cash equivalents at the end of period 305,600 368,403
The notes on pages 59 to 86 are an integral part of these Consolidated Financial Statements.