TomTom 2010 Annual Report Download - page 74
Download and view the complete annual report
Please find page 74 of the 2010 TomTom annual report below. You can navigate through the pages in the report by either clicking on the pages listed below, or by using the keyword search tool below to find specific information within the annual report.
p 72 / TomTom Annual Report and Accounts 2010
12. EARNINGS PER SHARE
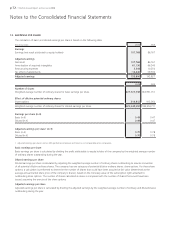
The calculation of basic and diluted earnings per share is based on the following data:
(€ in thousands) 2010 2009
Earnings
Earnings (net result attributed to equity holders) 107,768 86,767
Adjusted earnings
Net result 107,768 86,767
Amortisation of acquired intangibles 61,136 66,340
Restructuring expenses 3,344 10,250
Tax effect of adjustments -16,442 -19,530
Adjusted earnings 155,806 143,827
2010 2009
Number of shares
Weighted average number of ordinary shares for basic earnings per share 221,723,538 183,991,151
Effect of dilutive potential ordinary shares
Share options 316,812 913,560
Weighted average number of ordinary shares for diluted earnings per share 222,040,350 184,904,711
Earnings per share (in €)
Basic (in €) 0.49 0.47
Diluted (in €) 0.49 0.47
Adjusted earnings per share1(in €)
Basic (in €) 0.70 0.78
Diluted (in €) 0.70 0.78
1 Adjusted earnings per share is not an IFRS performance measure and hence is not comparable across companies.
Basic earnings per share
Basic earnings per share is calculated by dividing the profit attributable to equity holders of the company by the weighted average number
of ordinary shares outstanding during the year.
Diluted earnings per share
Diluted earnings per share is calculated by adjusting the weighted average number of ordinary shares outstanding to assume conversion
of all potential dilutive ordinary shares. The company has one category of potential dilutive ordinary shares: share options. For these share
options, a calculation is performed to determine the number of shares that could have been acquired at fair value (determined as the
average annual market share price of the company’s shares), based on the monetary value of the subscription rights attached to
outstanding share options. The number of shares calculated as above is compared with the number of shares that would have been
issued, assuming the exercise of the share options.
Adjusted earnings per share
Adjusted earnings per share is calculated by dividing the adjusted earnings by the weighted average number of ordinary and diluted shares
outstanding during the year.
Notes to the Consolidated Financial Statements


