TomTom 2010 Annual Report Download - page 21
Download and view the complete annual report
Please find page 21 of the 2010 TomTom annual report below. You can navigate through the pages in the report by either clicking on the pages listed below, or by using the keyword search tool below to find specific information within the annual report.-
 1
1 -
2
-
3
-
4
-
5
-
6
-
7
-
8
-
9
-
10
-
 11
11 -
 12
12 -
 13
13 -
 14
14 -
 15
15 -
 16
16 -
 17
17 -
 18
18 -
 19
19 -
 20
20 -
 21
21 -
 22
22 -
 23
23 -
 24
24 -
 25
25 -
 26
26 -
 27
27 -
 28
28 -
 29
29 -
 30
30 -
 31
31 -
32
-
33
-
34
-
35
-
36
-
37
-
38
-
39
-
40
-
41
-
42
-
43
-
44
-
45
-
46
-
47
-
48
-
49
-
50
-
51
-
52
-
53
-
54
-
55
-
56
-
57
-
58
-
59
-
60
-
61
-
62
-
63
-
64
-
65
-
66
-
67
-
68
-
69
-
70
-
71
-
72
-
73
-
74
-
75
-
76
-
77
-
78
-
79
-
80
-
81
-
82
-
83
-
84
-
85
-
86
-
87
-
88
-
89
-
90
-
91
-
92
-
93
-
94
-
95
-
96
-
97
-
98
-
99
-
100
 |
 |

p 19 / TomTom Annual Report and Accounts 2010
FINANCIAL REVIEW 20101
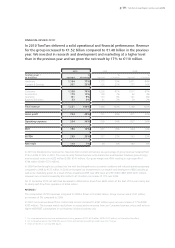
In 2010 TomTom delivered a solid operational and financial performance. Revenue
for the group increased to €1.52 billion compared to €1.48 billion in the previous
year. We invested in research and development and marketing at a higher level
than in the previous year and we grew the net result by 17% to €110 million.
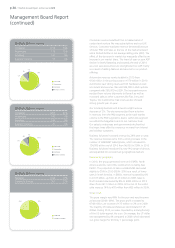
2010 2009 20082
TomTom group1, 3 % % %
(in € millions) reported of revenue reported of revenue reported of revenue
Hardware 1,164 77% 1,175 79% 1,471 84%
Content & Services 357 23% 305 21% 277 16%
Consumer 1,158 76% 1,205 81% 1,517 87%
Automotive 179 12% 100 7% 62 4%
Licensing 131 9% 133 9% 141 8%
Business Solutions 53 3% 41 3% 29 2%
Total revenue 1,521 100% 1,480 100% 1,748 100%
Gross profit 744 49% 731 49% 871 50%
Operating expenses 554 36% 500 34% 627 36%
EBIT 190 12% 231 16% 244 14%
EBITDA 299 20% 337 23% 343 20%
Net result 110 7% 94 6% 143 8%
In 2010 we broadened our revenue mix. Revenues from content and services as a percentage of group revenue increased from
21% in 2009 to 23% in 2010. The more recently formed business units Automotive and Business Solutions grew strongly
and increased revenue to €232 million (2009: €141 million). Our gross margin was 49% resulting in a gross profit of
€744 million (2009: €731 million).
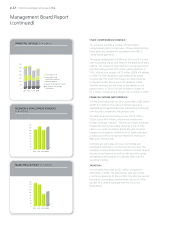
In 2009 TomTom brought its cost base into line with the changed macro economic conditions and reduced operating expenses
compared to 2008 by €127 million. In 2010 we increased our investments in our research and development (R&D) activities as
well as our marketing spend. As a result of these investments EBIT was 18% lower at €190 million (EBIT 2009: €231 million).
However our net result increased by €16 million to €110 million, an increase of 17% over 2009.
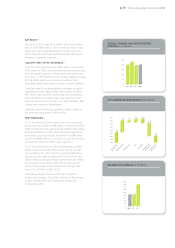
On 31 December 2010 net debt had decreased to €294 million down from €442 million at the start of the year mainly due
to strong cash flow from operations of €265 million.
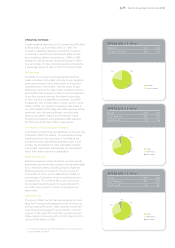
REVENUE /
The composition of 2010 revenues compared to 2009 is shown in the table above. Group revenue was €1,521 million,
an increase of 3% compared to 2009.
In 2010 our revenues derived from content and services increased to €357 million a year on year increase of 17% (2009:
€305 million). The increase mainly results from increased service revenues from our Consumer business unit as well as from
higher WEBFLEET subscriptions in our Business Solutions business unit.
1 For comparative reasons we have excluded restructuring expenses (2010: €3.3 million, 2009: €10.3 million) and the related tax effects.
2 For comparative reasons the 2008 data are pro forma and we have excluded goodwill impairment charges.
3 Totals are based on non-rounded figures.