TomTom 2010 Annual Report Download - page 22
Download and view the complete annual report
Please find page 22 of the 2010 TomTom annual report below. You can navigate through the pages in the report by either clicking on the pages listed below, or by using the keyword search tool below to find specific information within the annual report.-
 1
1 -
2
-
3
-
4
-
5
-
6
-
7
-
8
-
9
-
10
-
11
-
 12
12 -
 13
13 -
 14
14 -
 15
15 -
 16
16 -
 17
17 -
 18
18 -
 19
19 -
 20
20 -
 21
21 -
 22
22 -
 23
23 -
 24
24 -
 25
25 -
 26
26 -
 27
27 -
 28
28 -
 29
29 -
 30
30 -
 31
31 -
 32
32 -
33
-
34
-
35
-
36
-
37
-
38
-
39
-
40
-
41
-
42
-
43
-
44
-
45
-
46
-
47
-
48
-
49
-
50
-
51
-
52
-
53
-
54
-
55
-
56
-
57
-
58
-
59
-
60
-
61
-
62
-
63
-
64
-
65
-
66
-
67
-
68
-
69
-
70
-
71
-
72
-
73
-
74
-
75
-
76
-
77
-
78
-
79
-
80
-
81
-
82
-
83
-
84
-
85
-
86
-
87
-
88
-
89
-
90
-
91
-
92
-
93
-
94
-
95
-
96
-
97
-
98
-
99
-
100
 |
 |

p 20 / TomTom Annual Report and Accounts 2010
Management Board Report
(continued)
Consumer revenue benefited from increased sales of
content and services like map subscriptions and our LIVE
Services. Consumer hardware revenue decreased because
of lower PND unit sales as the size of the market reduced
and a limited decline in our average selling price (ASP). The
effect of the decrease in market size was partly offset by an
increase in our market share. The trend of year on year ASP
decline is clearly flattening and towards the end of 2010
we even saw areas where we strengthened our ASP mainly
as a result of adding features and services to our product
offering.
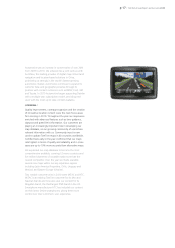
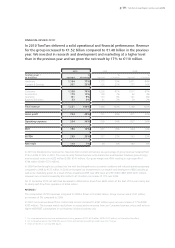
Automotive revenue nearly doubled in 2010 from
€100 million in the previous year to €179 million in 2010.
Automotive saw strong revenues from hardware as well
as content and services. We sold 584,000 in dash systems
compared with 260,000 in 2009. The increased revenue
resulted from volume shipments to Renault as well as
increased sales to other customers like Fiat, Sony and
Toyota. Our Automotive map revenues also showed
strong growth year on year.
Our Licensing business unit showed a slight revenue
decrease of 2%. The decrease resulted from a decline
in revenues from the PND segment as the total market
volume in the PND segment is down; within this segment
we added the Magellan brand to our customer base.
Our sales to enterprises and governments declined but
the impact was offset by a revenue increase from internet
and wireless customers.
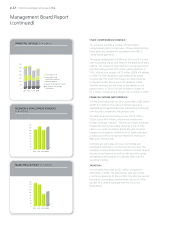
Business Solutions increased revenue by 29% year on year.
The revenue increase came from a strong increase in the
number of WEBFLEET subscriptions, which increased to
134,000 at the end of 2010 from 96,000 in 2009. In 2010
Business Solutions introduced its new PRO range of devices
and expanded into several new geographical markets.
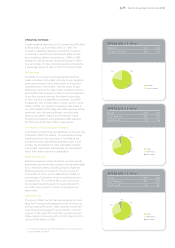
Revenue by geography
In 2010, the group generated revenue in EMEA, North
America and the rest of the world which is mainly Asia
Pacific. The proportion of sales outside EMEA decreased
slightly to 30% in 2010 (2009: 32%) as a result of lower
sales in North America. In EMEA, revenue increased by 6%
to €1.07 billion, up from €1.01 billion in 2009. Sales in
North America decreased by 8% to €380 million in 2010
down from €411 million in 2009. In the rest of the world
sales were up 14% to €70 million from €62 million in 2009.
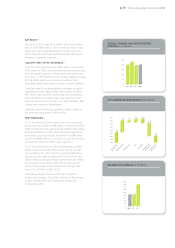
Gross result
The gross margin was 49% for the year and was the same
as last year (2009: 49%). The gross profit increased to
€744 million, an increase of €13 million or 2% over 2009.
The majority of trade purchases are denominated in US
dollars. During 2010, we were impacted by a strengthening
of the US dollar against the euro. On average, the US dollar
rate strengthened by 4% compared to 2009, which decreased
our gross margin for 2010 by 1 percentage point.
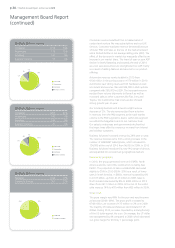
REVENUE 2009 (in € millions)
Consumer 1,205 81%
Automotive 100 7%
Licensing 133 9%
Business Solutions 41 3%
81%
3%
7%
9%
Consumer
Automotive
Licensing
Business Solutions
REVENUE 2010 (in € millions)
Hardware 1,164 77%
Content & Services 357 23%
77%
23%
Hardware
Content & Services
REVENUE 2010 (in € millions)
Consumer 1,158 76%
Automotive 179 12%
Licensing 131 9%
Business Solutions 53 3%
Consumer
Automotive
Licensing
Business Solutions
76%
3%
12%
9%