TomTom 2010 Annual Report Download - page 23
Download and view the complete annual report
Please find page 23 of the 2010 TomTom annual report below. You can navigate through the pages in the report by either clicking on the pages listed below, or by using the keyword search tool below to find specific information within the annual report.-
 1
1 -
2
-
3
-
4
-
5
-
6
-
7
-
8
-
9
-
10
-
11
-
12
-
 13
13 -
 14
14 -
 15
15 -
 16
16 -
 17
17 -
 18
18 -
 19
19 -
 20
20 -
 21
21 -
 22
22 -
 23
23 -
 24
24 -
 25
25 -
 26
26 -
 27
27 -
 28
28 -
 29
29 -
 30
30 -
 31
31 -
 32
32 -
 33
33 -
34
-
35
-
36
-
37
-
38
-
39
-
40
-
41
-
42
-
43
-
44
-
45
-
46
-
47
-
48
-
49
-
50
-
51
-
52
-
53
-
54
-
55
-
56
-
57
-
58
-
59
-
60
-
61
-
62
-
63
-
64
-
65
-
66
-
67
-
68
-
69
-
70
-
71
-
72
-
73
-
74
-
75
-
76
-
77
-
78
-
79
-
80
-
81
-
82
-
83
-
84
-
85
-
86
-
87
-
88
-
89
-
90
-
91
-
92
-
93
-
94
-
95
-
96
-
97
-
98
-
99
-
100
 |
 |

p 21 / TomTom Annual Report and Accounts 2010
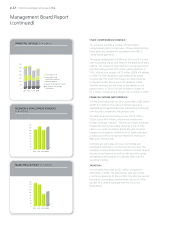
OPERATING EXPENSES1/
Overall operating expenses in 2010 increased by €54 million
to €554 million, up from €500 million in 2009. The
increase in operating expenses resulted from increased
investment in research and development (R&D) as well
as in marketing. Headcount grew from 3,089 to 3,487
employees, with the growth mainly taking place in R&D.
As a percentage of sales, operating expenses increased by
2 percentage points to 36% in 2010 from 34% in 2009.
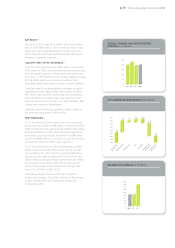
R&D expenses
The ability of our research and development teams to
create innovative, high-quality and easy-to-use navigation
products and services is the critical driver of the group’s
competitiveness in the market. TomTom strives to gain
efficiencies mainly in the map content production process
and benefits from synergies resulting from the combination
of our four business units and their shared technology.
In 2010 TomTom increased R&D investment. Total R&D
increased by 16% to €162 million in 2010, up from €139
million in 2009. The growth in investment was mainly in
our shared platform technology units. R&D expenses include
personnel costs, third party software, manufacturing
design costs, patent creation and maintenance costs.
Excluding amortisation and capitalisation R&D expenses
for 2010 were €194 million (2009: €165 million).
Amortisation of technology and databases
Amortisation of technology and databases for the year was
€78 million (2009: €75 million). The amortisation charge
mainly results from the acquisition of Tele Atlas as we
amortise the assets identified at acquisition date. It also
includes the amortisation of other intangibles resulting
from smaller acquisitions and internally generated assets
which fulfil certain criteria for capitalisation.
Marketing expenses
Marketing expenses include third party expenses such as
advertising expenses and any expenses directly attributable
to our marketing teams, including personnel expenses.
Marketing expenses increased 21% year over year to
€105 million in 2010, up from €86 million in 2009. As
a percentage of Consumer revenue marketing expenses
increased from 7% in 2009 to 9% in the current year.
We increased marketing spend to create attention for
our traffic services and to continue to strengthen our
brand name.
SG&A expenses
The group’s SG&A function has been designed to create
value for the group by leveraging the scale of the group
and by creating efficiencies. SG&A expenses include the
costs of personnel engaged in sales activities, customer
support, IT, HR, legal, office and other general expenses.
SG&A expenses increased by 4% to €197 million in 2010,
up from €189 million in 2009.
1 For comparative reasons we have excluded restructuring expenses
and the related tax effects.
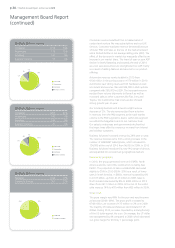
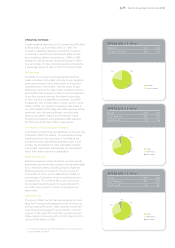
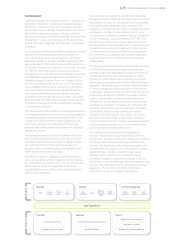
REVENUE 2009 (in € millions)
Hardware 1,175 79%
Content & Services 305 21%
79%
21%
Hardware
Content & Services
REVENUE 2010 (in € millions)
Europe 1,070 70%
North America 380 25%
Rest of world 70 5%
70%
25%
5%
Europe
North America
Rest of world
REVENUE 2009 (in € millions)
Europe 1,007 68%
North America 411 28%
Rest of world 62 4%
68%
28%
4%
Europe
North America
Rest of world