TomTom 2010 Annual Report Download - page 75
Download and view the complete annual report
Please find page 75 of the 2010 TomTom annual report below. You can navigate through the pages in the report by either clicking on the pages listed below, or by using the keyword search tool below to find specific information within the annual report.-
 1
1 -
2
-
3
-
4
-
5
-
6
-
7
-
8
-
9
-
10
-
11
-
12
-
13
-
14
-
15
-
16
-
17
-
18
-
19
-
20
-
21
-
22
-
23
-
24
-
25
-
26
-
27
-
28
-
29
-
30
-
31
-
32
-
33
-
34
-
35
-
36
-
37
-
38
-
39
-
40
-
41
-
42
-
43
-
44
-
45
-
46
-
47
-
48
-
49
-
50
-
51
-
52
-
53
-
54
-
55
-
56
-
57
-
58
-
59
-
60
-
61
-
62
-
63
-
64
-
 65
65 -
 66
66 -
 67
67 -
 68
68 -
 69
69 -
 70
70 -
 71
71 -
 72
72 -
 73
73 -
 74
74 -
 75
75 -
 76
76 -
 77
77 -
 78
78 -
 79
79 -
 80
80 -
 81
81 -
 82
82 -
 83
83 -
 84
84 -
 85
85 -
86
-
87
-
88
-
89
-
90
-
91
-
92
-
93
-
94
-
95
-
96
-
97
-
98
-
99
-
100
 |
 |
p 73 / TomTom Annual Report and Accounts 2010
Notes to the Consolidated Financial Statements
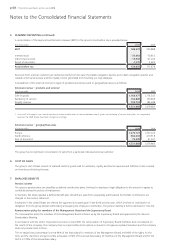
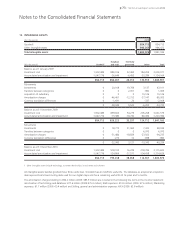
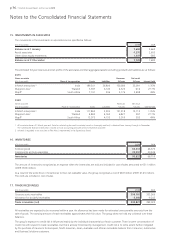
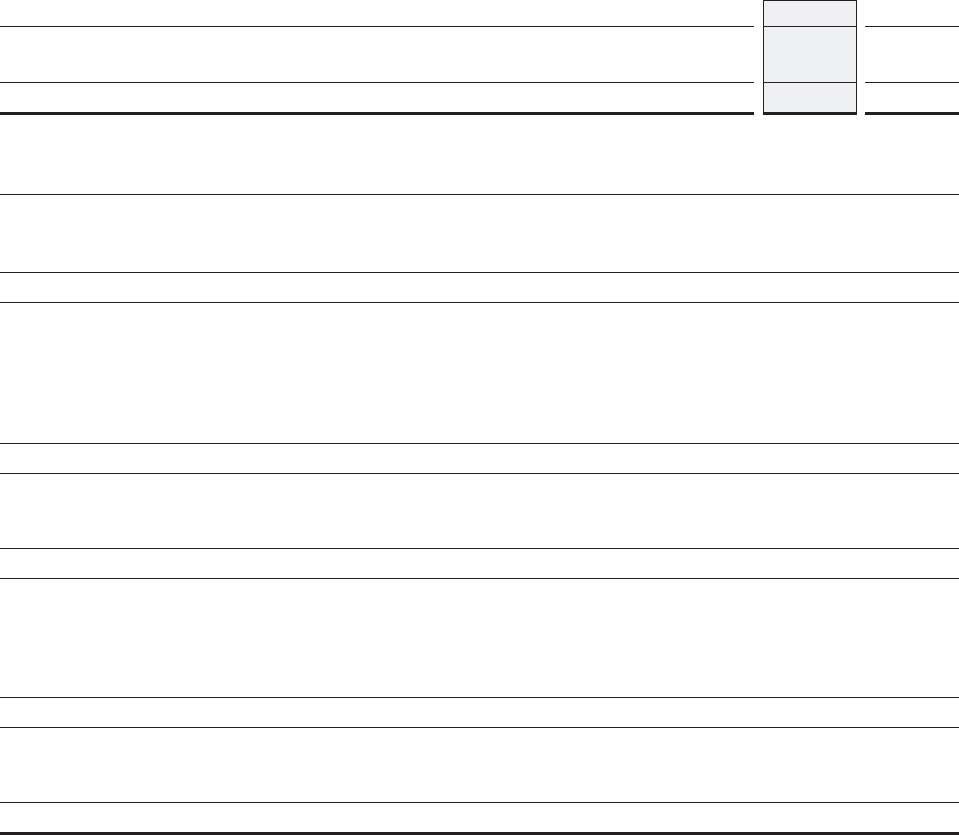
13. INTANGIBLE ASSETS
(€ in thousands) 2010 2009
Goodwill 854,713 854,713
Other intangible assets 946,263 986,472
Total intangible assets 1,800,976 1,841,185
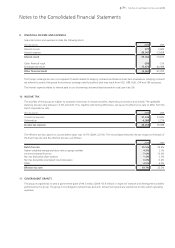
Database Internally
(€ in thousands) Goodwill and tools generated Other1 Total
Balance as at 1 January 2009
Investment cost 1,902,489 880,916 32,462 184,204 3,000,071
Accumulated amortisation and impairment -1,047,776 -26,649 -6,450 -53,289 -1,134,164
854,713 854,267 26,012 130,915 1,865,907
Movements
Investments 0 20,108 19,766 3,137 43,011
Transfers between categories 0 0 2,051 -982 1,069
Acquisition of subsidiary 0 0 0 19,126 19,126
Amortisation charges 0 -46,461 -12,312 -27,147 -85,920
Currency translation differences 0 -1,691 20 -337 -2,008
0 -28,044 9,525 -6,203 -24,722
Balance as at 31 December 2009
Investment cost 1,902,489 899,603 54,279 205,208 3,061,579
Accumulated amortisation and impairment -1,047,776 -73,380 -18,742 -80,496 -1,220,394
854,713 826,223 35,537 124,712 1,841,185
Movements
Investments 0 18,772 21,962 7,305 48,039
Transfers between categories 0 0 0 6,970 6,970
Amortisation charges 0 -51,484 -18,829 -23,922 -94,235
Currency translation differences 0 -273 -12 -698 -983
0 -32,985 3,121 -10,345 -40,209
Balance as at 31 December 2010
Investment cost 1,902,489 918,102 76,229 218,785 3,115,605
Accumulated amortisation and impairment -1,047,776 -124,864 -37,571 -104,418 -1,314,629
854,713 793,238 38,658 114,367 1,800,976
1 Other intangible assets include technology, customer relationships, brand name and software.
All intangible assets besides goodwill have finite useful lives. Goodwill has an indefinite useful life. The database as acquired at acquisition
date represents all stored routing data used for our digital maps and has a remaining useful life of 16 years and 5 months.
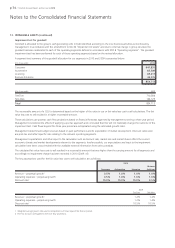
The amortisation charges totalling to €94.2 million (2009: €85.9 million) are included in the following line items in the Income Statement:
amortisation of technology and database: €77.6 million (2009:€75.0 million); R&D expenses: €10.0 million (2009: €7.6 million); Marketing
expenses: €1.7 million (2009: €0.4 million) and Selling, general and administrative expenses: €4.9 (2009: €2.9 million).