TomTom 2010 Annual Report Download - page 36
Download and view the complete annual report
Please find page 36 of the 2010 TomTom annual report below. You can navigate through the pages in the report by either clicking on the pages listed below, or by using the keyword search tool below to find specific information within the annual report.-
 1
1 -
2
-
3
-
4
-
5
-
6
-
7
-
8
-
9
-
10
-
11
-
12
-
13
-
14
-
15
-
16
-
17
-
18
-
19
-
20
-
21
-
22
-
23
-
24
-
25
-
 26
26 -
 27
27 -
 28
28 -
 29
29 -
 30
30 -
 31
31 -
 32
32 -
 33
33 -
 34
34 -
 35
35 -
 36
36 -
 37
37 -
 38
38 -
 39
39 -
 40
40 -
 41
41 -
 42
42 -
 43
43 -
 44
44 -
 45
45 -
 46
46 -
47
-
48
-
49
-
50
-
51
-
52
-
53
-
54
-
55
-
56
-
57
-
58
-
59
-
60
-
61
-
62
-
63
-
64
-
65
-
66
-
67
-
68
-
69
-
70
-
71
-
72
-
73
-
74
-
75
-
76
-
77
-
78
-
79
-
80
-
81
-
82
-
83
-
84
-
85
-
86
-
87
-
88
-
89
-
90
-
91
-
92
-
93
-
94
-
95
-
96
-
97
-
98
-
99
-
100
 |
 |

p 34 / TomTom Annual Report and Accounts 2010
Business
Risks (continued)
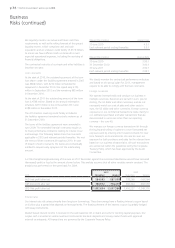
Relevant Period Ending Interest Cover
30 June 2010 4.5:1
Each relevant period ending thereafter 5.0:1
Relevant Period Ending Leverage Ratio
30 June 2010 3.50:1
31 December 2010 3.00:1
30 June 2011 2.50:1
Each relevant period ending thereafter 2.00:1
We closely monitor the contractual performance indicators
and based on the group’s plan for 2011, management
expects to be able to comply with the loan covenants.
Foreign currencies
We operate internationally and conduct our business in
multiple currencies. Revenues are earned in euro, pound
sterling, the US dollar and other currencies, and do not
necessarily match our cost of sales and other costs in
euro, the US dollar and other currencies. Foreign currency
exposures on our commercial transactions relate mainly to
our estimated purchases and sales transactions that are
denominated in currencies other than our reporting
currency – the euro (€).
We manage our foreign currency transaction risk through
the buying and selling of options to cover forecasted net
exposures and by entering into forward contracts for near
term forecasts and commitments. We aim to cover our
exposure for both purchases and sales for the relevant term
based on our business characteristics. All such transactions
are carried out within the guidelines set by the Corporate
Treasury Policy, which has been approved by the Audit
Committee.
We regularly monitor our actual and future cash flow
requirements as well as the rolling forecast of the group’s
liquidity reserve, which comprises cash and cash
equivalents and an undrawn credit facility of €174 million,
to ensure we have sufficient cash on demand to meet
expected operational expenses, including the servicing of
financial obligations.
The contractual maturity of our trade and other liabilities is
less than one year.
Loan covenants
At the start of 2010, the outstanding amount of the term
loan drawn under the facilities agreement entered in 2007
was €808 million, with €210 million scheduled for
repayment in December 2010. We repaid early €125
million in September 2010 and the remaining €85 million
in December 2010.
At the start of 2011 the outstanding amount of the term
loan is €598 million. Based on the annual redemption
schedule, €210 million is due in December 2011 and
€388 million in December 2012.
The €174 million revolving credit facility included in
the facilities agreement remained entirely undrawn as of
31 December 2010.
The terms of the facilities agreement were amended in
June 2009. The amended financial covenants require us
to meet performance indicators relating to interest cover
and leverage. The following tables show the covenants
applicable in 2010 and relevant periods thereafter. We met
the terms of these covenants throughout 2010. In case
of breach of such covenants, the banks are contractually
entitled to request early repayment of the outstanding
amount.
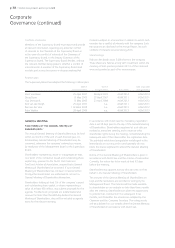
A 2.5% strengthening/weakening of the euro as of 31 December against the currencies listed below would have increased
(decreased) profit or loss by the amount shown below. This analysis assumes that all other variables remain constant. The
analysis was performed on the same basis for 2009.
2010 2009
(in €) Strengthen Weaken Strengthen Weaken
AUD (net profit after tax) 584,065 -587,030 178,260 -169,564
GBP (net profit after tax) 796,912 -778,473 692,324 -658,559
USD (Net profit after tax) 1,852,634 -2,037,586 1,416,227 -1,349,176
Interest rates
Our interest rate risk arises primarily from long-term borrowings. These borrowings have a floating interest coupon based
on Euribor plus a spread that depends on leverage levels. The floating element of the interest coupon is partially hedged
with swap instruments.
Market-based interest income is received on the cash balances left on bank accounts for working capital purposes. Our
surplus cash is invested in vanilla investment instruments like bank deposits and money market funds with approved
external counterparts. All transactions are governed by the Corporate Treasury Policy.