TomTom 2010 Annual Report Download - page 78
Download and view the complete annual report
Please find page 78 of the 2010 TomTom annual report below. You can navigate through the pages in the report by either clicking on the pages listed below, or by using the keyword search tool below to find specific information within the annual report.-
 1
1 -
2
-
3
-
4
-
5
-
6
-
7
-
8
-
9
-
10
-
11
-
12
-
13
-
14
-
15
-
16
-
17
-
18
-
19
-
20
-
21
-
22
-
23
-
24
-
25
-
26
-
27
-
28
-
29
-
30
-
31
-
32
-
33
-
34
-
35
-
36
-
37
-
38
-
39
-
40
-
41
-
42
-
43
-
44
-
45
-
46
-
47
-
48
-
49
-
50
-
51
-
52
-
53
-
54
-
55
-
56
-
57
-
58
-
59
-
60
-
61
-
62
-
63
-
64
-
65
-
66
-
67
-
 68
68 -
 69
69 -
 70
70 -
 71
71 -
 72
72 -
 73
73 -
 74
74 -
 75
75 -
 76
76 -
 77
77 -
 78
78 -
 79
79 -
 80
80 -
 81
81 -
 82
82 -
 83
83 -
 84
84 -
 85
85 -
 86
86 -
 87
87 -
 88
88 -
89
-
90
-
91
-
92
-
93
-
94
-
95
-
96
-
97
-
98
-
99
-
100
 |
 |
p 76 / TomTom Annual Report and Accounts 2010
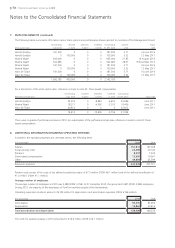
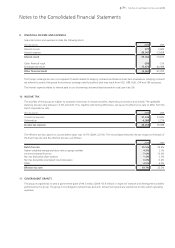
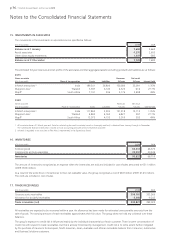
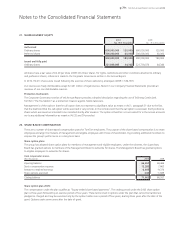
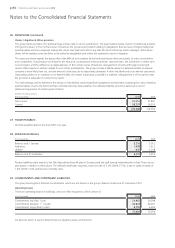
15. INVESTMENTS IN ASSOCIATES
The movements in the investments in associates can be specified as follows:
(€ in thousands) 2010 2009
Balance as at 1 January 7,683 5,663
Result associates -1,270 2,603
Other direct equity movements 1,307 -583
Balance as at 31 December 7,720 7,683
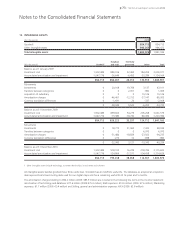
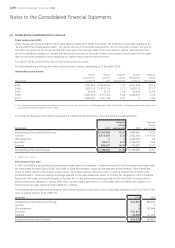
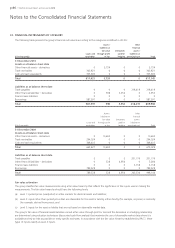
The estimated full year revenues and net profits of the associates and their aggregated assets (excluding goodwill) and liabilities are as follows:
2010
Name associate Revenues Net result
(€ in thousands) Place of incorporation Assets Liabilities full year full year Interest held
Infotech enterprises1,2 India 189,541 36,806 150,086 25,091 1.35%
Mappoint Asia1 Thailand 5,947 6,145 4,325 -416 27.7%
MapIT1 South Africa 7,741 336 5,176 2,498 49%
2009
Name associate Revenues Net result
(€ in thousands) Place of incorporation Assets Liabilities full year full year Interest held
Infotech enterprises1,2 India 117,860 2,905 131,918 13,712 1.35%
Mappoint Asia1 Thailand 4,890 4,762 6,827 497 27.7%
MapIT1 South Africa 13,075 4,105 5,019 503 49%
1 All associates have a 31 March year-end. Data for calculating the result associate, based on the equity method, is obtained from January through to December.
The summarised financial information is based on local accounting principles of each respective associate.
2 Infotech is regarded as an associate as Tele Atlas is represented in the Supervisory Board.
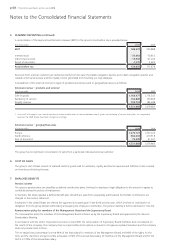
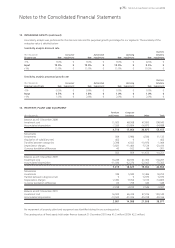
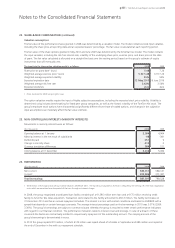
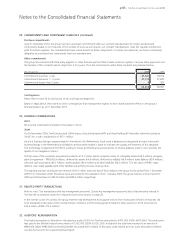
16. INVENTORIES
(€ in thousands) 2010 2009
Finished goods 63,431 46,370
Components and sub-assemblies 30,391 20,349
Inventories 93,822 66,719
The amount of inventories recognised as an expense when the inventories are sold and included in cost of sales amounted to €511 million
(2009: €506 million).
As a result of the write-down of inventories to their net realisable value, the group recognised a cost of €8.9 million (2009: €14.5 million).
The costs are included in cost of sales.
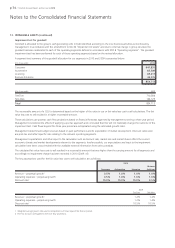
17. TRADE RECEIVABLES
(€ in thousands) 2010 2009
Gross accounts receivables 309,181 303,266
Allowance for doubtful receivables -3,360 -9,242
Trade receivables (net) 305,821 294,024
All receivables are expected to be recovered within a year. An allowance has been made for estimated unrecoverable amounts from the
sale of goods. The carrying amount of trade receivables approximates their fair value. The group does not hold any collateral over these
balances.
The group’s exposure to credit risk is influenced mainly by the individual characteristics of each customer. There is some concentration of
credit risk with respect to trade receivables, but this is actively monitored by management. Credit risk is to some extent further mitigated
by the purchase of insurance for European, North American, Asian, Australian and African receivables balance from Consumer, Automotive
and Business Solutions customers.
Notes to the Consolidated Financial Statements