Tesco 2010 Annual Report Download - page 96
Download and view the complete annual report
Please find page 96 of the 2010 Tesco annual report below. You can navigate through the pages in the report by either clicking on the pages listed below, or by using the keyword search tool below to find specific information within the annual report.-
 1
1 -
2
-
3
-
4
-
5
-
6
-
7
-
8
-
9
-
10
-
11
-
12
-
13
-
14
-
15
-
16
-
17
-
18
-
19
-
20
-
21
-
22
-
23
-
24
-
25
-
26
-
27
-
28
-
29
-
30
-
31
-
32
-
33
-
34
-
35
-
36
-
37
-
38
-
39
-
40
-
41
-
42
-
43
-
44
-
45
-
46
-
47
-
48
-
49
-
50
-
51
-
52
-
53
-
54
-
55
-
56
-
57
-
58
-
59
-
60
-
61
-
62
-
63
-
64
-
65
-
66
-
67
-
68
-
69
-
70
-
71
-
72
-
73
-
74
-
75
-
76
-
77
-
78
-
79
-
80
-
81
-
82
-
83
-
84
-
85
-
 86
86 -
 87
87 -
 88
88 -
 89
89 -
 90
90 -
 91
91 -
 92
92 -
 93
93 -
 94
94 -
 95
95 -
 96
96 -
 97
97 -
 98
98 -
 99
99 -
 100
100 -
 101
101 -
 102
102 -
 103
103 -
 104
104 -
 105
105 -
 106
106 -
107
-
108
-
109
-
110
-
111
-
112
-
113
-
114
-
115
-
116
-
117
-
118
-
119
-
120
-
121
-
122
-
123
-
124
-
125
-
126
-
127
-
128
-
129
-
130
-
131
-
132
-
133
-
134
-
135
-
136
 |
 |

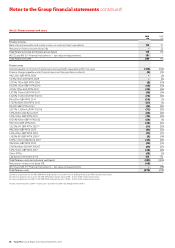
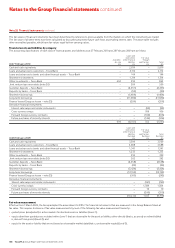
Notes to the Group financial statements continued
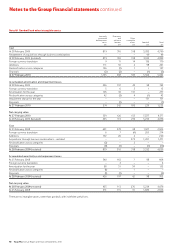
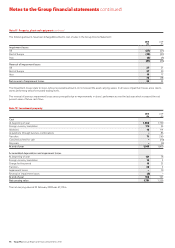
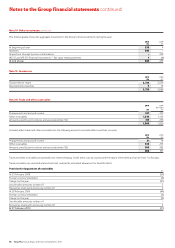
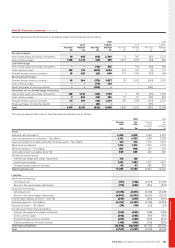
Note 11 Property, plant and equipment continued
The following amounts have been (charged)/credited to cost of sales in the Group Income Statement:
2010 2009
£m £m
Impairment losses
UK (27) (21)
Rest of Europe (18) (31)
Asia (6) (4)
(51) (56)
Reversal of impairment losses
UK 27 21
Rest of Europe 37 50
Asia 10 17
74 88
Net reversal of impairment losses 23 32
The impairment losses relate to stores whose recoverable amounts do not exceed the asset carrying values. In all cases, impairment losses arose due to
stores performing below forecasted trading levels.
The reversal of previous impairment losses arose principally due to improvements in stores’ performances over the last year which increased the net
present value of future cash flows.
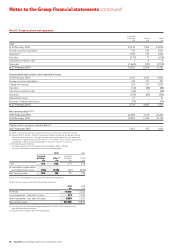
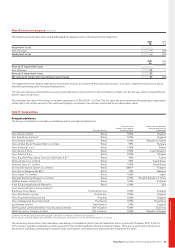
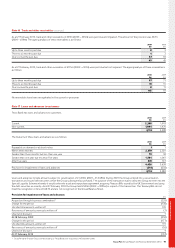
Note 12 Investment property
2010 2009
£m £m
Cost
At beginning of year 1,660 1,190
Foreign currency translation 172 24
Additions 16 114
Acquisitions through business combinations – 86
Transfers 71 260
Classified as held for sale – (10)
Disposals – (4)
At end of year 1,919 1,660
Accumulated depreciation and impairment losses
At beginning of year 121 78
Foreign currency translation 14 3
Charge for the period 16 25
Transfers 40 5
Impairment losses – 10
Reversal of impairment losses (3) –
At end of year 188 121
Net carrying value 1,731 1,539
The net carrying value at 23 February 2008 was £1,112m.
94 Tesco PLC Annual Report and Financial Statements 2010