Tesco 2010 Annual Report Download - page 86
Download and view the complete annual report
Please find page 86 of the 2010 Tesco annual report below. You can navigate through the pages in the report by either clicking on the pages listed below, or by using the keyword search tool below to find specific information within the annual report.-
 1
1 -
2
-
3
-
4
-
5
-
6
-
7
-
8
-
9
-
10
-
11
-
12
-
13
-
14
-
15
-
16
-
17
-
18
-
19
-
20
-
21
-
22
-
23
-
24
-
25
-
26
-
27
-
28
-
29
-
30
-
31
-
32
-
33
-
34
-
35
-
36
-
37
-
38
-
39
-
40
-
41
-
42
-
43
-
44
-
45
-
46
-
47
-
48
-
49
-
50
-
51
-
52
-
53
-
54
-
55
-
56
-
57
-
58
-
59
-
60
-
61
-
62
-
63
-
64
-
65
-
66
-
67
-
68
-
69
-
70
-
71
-
72
-
73
-
74
-
75
-
 76
76 -
 77
77 -
 78
78 -
 79
79 -
 80
80 -
 81
81 -
 82
82 -
 83
83 -
 84
84 -
 85
85 -
 86
86 -
 87
87 -
 88
88 -
 89
89 -
 90
90 -
 91
91 -
 92
92 -
 93
93 -
 94
94 -
 95
95 -
 96
96 -
97
-
98
-
99
-
100
-
101
-
102
-
103
-
104
-
105
-
106
-
107
-
108
-
109
-
110
-
111
-
112
-
113
-
114
-
115
-
116
-
117
-
118
-
119
-
120
-
121
-
122
-
123
-
124
-
125
-
126
-
127
-
128
-
129
-
130
-
131
-
132
-
133
-
134
-
135
-
136
 |
 |

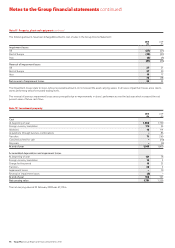
Notes to the Group financial statements continued
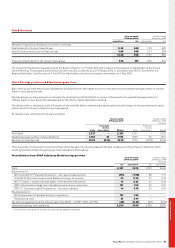
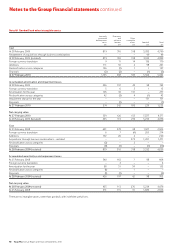
Note 2 Segmental reporting continued
Other segment information
Total
Tesco at actual
UK ROE Asia US Bank exchange
Year ended 27 February 2010 £m £m £m £m £m £m
Capital expenditure (including acquisitions through business combinations):
Property, plant and equipment 1,485 518 736 141 44 2,924
Investment property – 8 8 – – 16
Goodwill and other intangible assets 124 21 91 – 25 261
Depreciation:
Property, plant and equipment (570) (260) (226) (29) (6) (1,091)
Investment property – (8) (8) – – (16)
Amortisation of intangible assets (116) (20) (14) – (127) (277)
Goodwill impairment losses recognised in the Group Income Statement – – (131) – – (131)
Impairment losses recognised in the Group Income Statement (27) (18) (6) – – (51)
Reversal of prior period impairment losses through the
Group Income Statement 27 40 10 – – 77
Other segment information
Total
Tesco at actual
UK ROE Asia US Bank exchange
Year ended 28 February 2009 – restated £m £m £m £m £m £m
Capital expenditure (including acquisitions through business combinations):
Property, plant and equipment 2,392 852 1,404 305 25 4,978
Investment property – 48 152 – – 200
Goodwill and other intangible assets 217 15 399 – 1,060 1,691
Depreciation:
Property, plant and equipment (565) (249) (176) (20) (1) (1,011)
Investment property – (9) (16) – – (25)
Amortisation of intangible assets (99) (16) (6) – (32) (153)
Goodwill impairment losses recognised in the Group Income Statement – – – – – –
Impairment losses recognised in the Group Income Statement (21) (41) (4) – – (66)
Reversal of prior period impairment losses through the
Group Income Statement 21 50 17 – – 88
Note 3 Income and expenses
2010 2009
From continuing operations £m £m
Profit before tax is stated after charging/(crediting) the following:
Profit arising on property-related items (377) (236)
Rental income, of which £351m (2009 – £304m) relates to investment properties (461) (349)
Direct operating expenses arising on rental earning investment properties 103 91
Costs of inventories recognised as an expense 42,504 40,779
Stock losses 1,000 870
Depreciation of property, plant and equipment and investment property 1,107 1,036
Net reversal of impairment of property, plant and equipment and impairment of investment property (26) (22)
Amortisation of internally-generated development intangible assets 103 88
Amortisation of other intangibles 174 65
Operating lease expenses† 927 738
† Operating lease expenses include £83m (2009 – £81m) for hire of plant and machinery.
84 Tesco PLC Annual Report and Financial Statements 2010