Tesco 2010 Annual Report Download - page 115
Download and view the complete annual report
Please find page 115 of the 2010 Tesco annual report below. You can navigate through the pages in the report by either clicking on the pages listed below, or by using the keyword search tool below to find specific information within the annual report.-
 1
1 -
2
-
3
-
4
-
5
-
6
-
7
-
8
-
9
-
10
-
11
-
12
-
13
-
14
-
15
-
16
-
17
-
18
-
19
-
20
-
21
-
22
-
23
-
24
-
25
-
26
-
27
-
28
-
29
-
30
-
31
-
32
-
33
-
34
-
35
-
36
-
37
-
38
-
39
-
40
-
41
-
42
-
43
-
44
-
45
-
46
-
47
-
48
-
49
-
50
-
51
-
52
-
53
-
54
-
55
-
56
-
57
-
58
-
59
-
60
-
61
-
62
-
63
-
64
-
65
-
66
-
67
-
68
-
69
-
70
-
71
-
72
-
73
-
74
-
75
-
76
-
77
-
78
-
79
-
80
-
81
-
82
-
83
-
84
-
85
-
86
-
87
-
88
-
89
-
90
-
91
-
92
-
93
-
94
-
95
-
96
-
97
-
98
-
99
-
100
-
101
-
102
-
103
-
104
-
 105
105 -
 106
106 -
 107
107 -
 108
108 -
 109
109 -
 110
110 -
 111
111 -
 112
112 -
 113
113 -
 114
114 -
 115
115 -
 116
116 -
 117
117 -
 118
118 -
 119
119 -
 120
120 -
 121
121 -
 122
122 -
 123
123 -
 124
124 -
 125
125 -
126
-
127
-
128
-
129
-
130
-
131
-
132
-
133
-
134
-
135
-
136
 |
 |

Financial statements
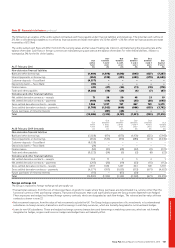
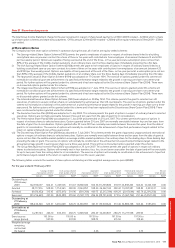
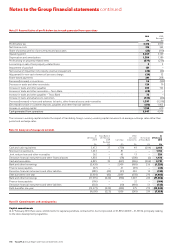
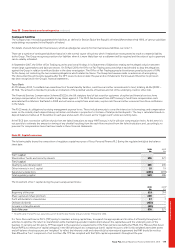
Note 27 Share-based payments continued
The Executive Directors participate in short-term and long-term bonus schemes designed to align their interests with those of shareholders. Full details
of these schemes can be found in the Directors’ Remuneration Report.
The fair value of shares awarded under these schemes is their market value on the date of award. Expected dividends are not incorporated into the fair
value except for awards under the US Long-Term Incentive Plan.
The number and weighted average fair value (WAFV) of share bonuses awarded during the period were:
2010 2009
Shares WAFV Shares WAFV
number pence number pence
Shares in Success 28,661,004 349.66 21,295,232 431.05
Executive Incentive Scheme 13,731,567 355.51 10,996,677 415.68
Performance Share Plan 2,120,058 375.37 2,123,237 353.76
US Long-Term Incentive Plan 80,622 482.00 673,716 403.80
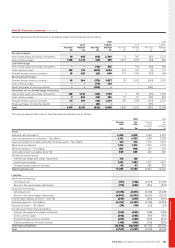
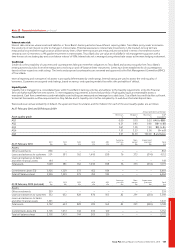
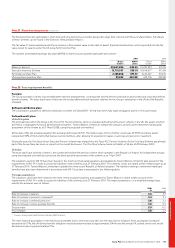
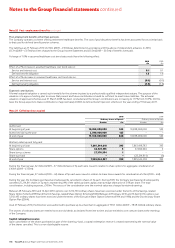
Note 28 Post-employment benefits
Pensions
The Group operates a variety of post-employment benefit arrangements, covering both funded defined contribution and funded and unfunded defined
benefit schemes. The most significant of these are the funded defined benefit pension schemes for the Group’s employees in the UK and the Republic
of Ireland.
Defined contribution plans
The contributions payable for defined contribution schemes of £12m (2009 – £11m) have been fully expensed against profits in the current year.
Defined benefit plans
United Kingdom
The principal plan within the Group is the Tesco PLC Pension Scheme, which is a funded defined benefit pension scheme in the UK, the assets of which
are held as a segregated fund and administered by trustees. Towers Watson Limited, an independent actuary, carried out the latest triennial actuarial
assessment of the scheme as at 31 March 2008, using the projected unit method.
At the date of the last actuarial valuation the actuarial deficit was £275m. The market value of the schemes’ assets was £3,987m and these assets
represented 94% of the benefits that had accrued to members, after allowing for expected increases in earnings and pensions in payment.
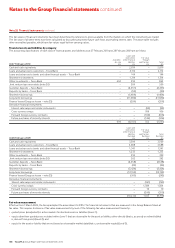
During the year, the One Stop Senior Executive Pension Scheme was merged into the Tesco PLC Pension Scheme. As the One Stop Scheme was already
part of the Group there has been no impact on the overall disclosures. The One Stop Scheme had a net liability of £4.6m at 28 February 2009.
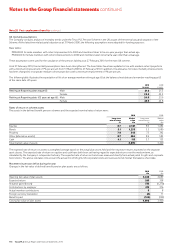
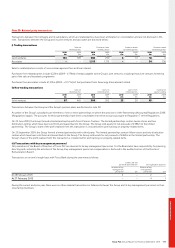
Overseas
The most significant overseas scheme is the funded defined benefit pension scheme which operates in the Republic of Ireland. An independent actuary,
using the projected unit method, carried out the latest actuarial assessment of the scheme as at 1 April 2007.
The valuations used for IAS 19 have been based on the most recent actuarial valuations and updated by Towers Watson Limited to take account of the
requirements of IAS 19 in order to assess the liabilities of the schemes as at 27 February 2010. The schemes’ assets are stated at their market values as at
27 February 2010. Towers Watson Limited have updated the most recent Republic of Ireland valuation. The liabilities relating to retirement healthcare
benefits have also been determined in accordance with IAS 19, and are incorporated in the following tables.
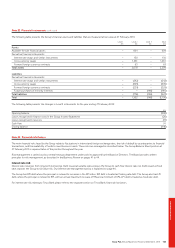
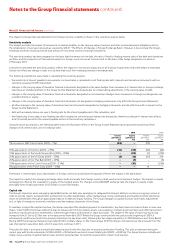
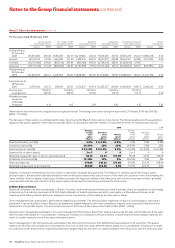
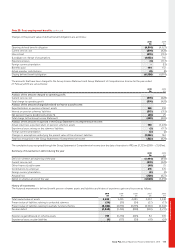
Principal assumptions
The valuations used have been based on the most recent actuarial valuations and updated by Towers Watson Limited to take account of the
requirements of IAS 19 in order to assess the liabilities of the schemes as at 27 February 2010. The major assumptions, on a weighted average basis,
used by the actuaries were as follows:
2010 2009
% %
Rate of increase in salaries 3.6 3.7
Rate of increase in pensions in payment* 3.4 3.1
Rate of increase in deferred pensions* 3.6 3.2
Rate of increase in career average benefits 3.6 3.2
Discount rate 5.9 6.5
Price inflation 3.6 3.2
* In excess of any Guaranteed Minimum Pension (GMP) element.
The main financial assumption is the real discount rate (the excess of the discount rate over the rate of price inflation). If this assumption increased/
decreased by 0.1%, the UK defined benefit obligation would decrease/increase by approximately £140m and the annual UK current service cost would
decrease/increase by approximately £17m.
Tesco PLC Annual Report and Financial Statements 2010 113