Tesco 2010 Annual Report Download - page 103
Download and view the complete annual report
Please find page 103 of the 2010 Tesco annual report below. You can navigate through the pages in the report by either clicking on the pages listed below, or by using the keyword search tool below to find specific information within the annual report.-
 1
1 -
2
-
3
-
4
-
5
-
6
-
7
-
8
-
9
-
10
-
11
-
12
-
13
-
14
-
15
-
16
-
17
-
18
-
19
-
20
-
21
-
22
-
23
-
24
-
25
-
26
-
27
-
28
-
29
-
30
-
31
-
32
-
33
-
34
-
35
-
36
-
37
-
38
-
39
-
40
-
41
-
42
-
43
-
44
-
45
-
46
-
47
-
48
-
49
-
50
-
51
-
52
-
53
-
54
-
55
-
56
-
57
-
58
-
59
-
60
-
61
-
62
-
63
-
64
-
65
-
66
-
67
-
68
-
69
-
70
-
71
-
72
-
73
-
74
-
75
-
76
-
77
-
78
-
79
-
80
-
81
-
82
-
83
-
84
-
85
-
86
-
87
-
88
-
89
-
90
-
91
-
92
-
 93
93 -
 94
94 -
 95
95 -
 96
96 -
 97
97 -
 98
98 -
 99
99 -
 100
100 -
 101
101 -
 102
102 -
 103
103 -
 104
104 -
 105
105 -
 106
106 -
 107
107 -
 108
108 -
 109
109 -
 110
110 -
 111
111 -
 112
112 -
 113
113 -
114
-
115
-
116
-
117
-
118
-
119
-
120
-
121
-
122
-
123
-
124
-
125
-
126
-
127
-
128
-
129
-
130
-
131
-
132
-
133
-
134
-
135
-
136
 |
 |

Financial statements
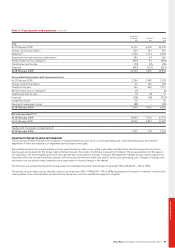
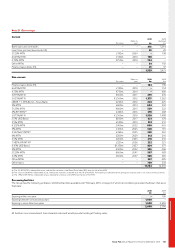
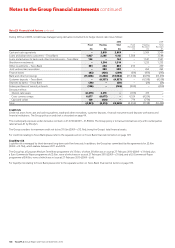
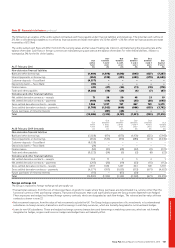
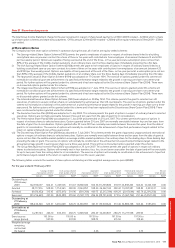
Note 21 Borrowings
Current
2010 2009
Maturity Restated
Par value year £m £m
Bank loans and overdrafts – – 575 3,014
Loan from joint ventures (note 30) – – 23 20
5.125% MTN £192m 2009 – 198
6.625% MTN £150m 2010 158 –
4.75% MTN €750m 2010 704 –
Other MTNs – – 24 192
Finance leases (note 35) – – 45 47
1,529 3,471
Non-current
Maturity 2010 2009
Par value year £m £m
Finance leases (note 35) – – 164 196
6.625% MTN £150m 2010 – 154
4.75% MTN €750m 2010 – 689
3.875% MTN €500m 2011 479 476
5.625% MTN €1,500m 2012 1,375 1,362
LIBOR + 1.33% Bond – Tesco Bank £225m 2012 224 225
5% MTN £600m 2014 604 592
5.125% MTN €600m 2015 539 522
4% RPI MTN(a) £263m 2016 270 268
5.875% MTN €1,500m 2016 1,520 1,488
5.5% USD Bond $850m 2017 621 678
5.5% MTN £350m 2019 351 351
6.125% MTN £900m 2022 890 901
5% MTN £515m 2023 520 515
3.322% LPI MTN(b) £265m 2025 269 267
6% MTN £200m 2029 212 216
5.5% MTN £200m 2033 210 216
1.982% RPI MTN(c) £221m 2036 222 221
6.15% USD Bond $1,150m 2037 834 977
5% MTN £300m 2042 306 306
5.125% MTN €600m 2047 587 628
5.2% MTN £500m 2057 500 500
Other MTNs – – 267 285
Other loans – – 780 358
11,744 12,391
(a) The 4% RPI MTN is redeemable at par, indexed for increases in the Retail Price Index (RPI) over the life of the MTN.
(b) The 3.322% LPI MTN is redeemable at par, indexed for increases in the RPI over the life of the MTN. The maximum indexation of the principal in any one year is 5%, with a minimum of 0%.
(c) The 1.982% RPI MTN is redeemable at par, indexed for increases in the RPI over the life of the MTN.
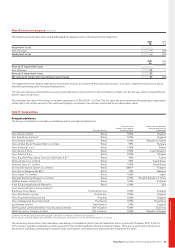
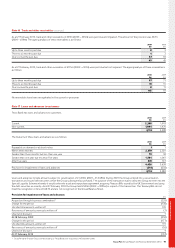
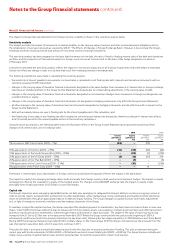
Borrowing facilities
The Group has the following undrawn committed facilities available at 27 February 2010, in respect of which all conditions precedent had been met as at
that date:
2010 2009
£m £m
Expiring within one year – 100
Expiring between one and two years 1,000 –
Expiring in more than two years 1,600 2,600
2,600 2,700
All facilities incur commitment fees at market rates and would provide funding at floating rates.
Tesco PLC Annual Report and Financial Statements 2010 101