Tesco 2010 Annual Report Download - page 12
Download and view the complete annual report
Please find page 12 of the 2010 Tesco annual report below. You can navigate through the pages in the report by either clicking on the pages listed below, or by using the keyword search tool below to find specific information within the annual report.-
 1
1 -
 2
2 -
 3
3 -
 4
4 -
 5
5 -
 6
6 -
 7
7 -
 8
8 -
 9
9 -
 10
10 -
 11
11 -
 12
12 -
 13
13 -
 14
14 -
 15
15 -
 16
16 -
 17
17 -
 18
18 -
 19
19 -
 20
20 -
 21
21 -
 22
22 -
23
-
24
-
25
-
26
-
27
-
28
-
29
-
30
-
31
-
32
-
33
-
34
-
35
-
36
-
37
-
38
-
39
-
40
-
41
-
42
-
43
-
44
-
45
-
46
-
47
-
48
-
49
-
50
-
51
-
52
-
53
-
54
-
55
-
56
-
57
-
58
-
59
-
60
-
61
-
62
-
63
-
64
-
65
-
66
-
67
-
68
-
69
-
70
-
71
-
72
-
73
-
74
-
75
-
76
-
77
-
78
-
79
-
80
-
81
-
82
-
83
-
84
-
85
-
86
-
87
-
88
-
89
-
90
-
91
-
92
-
93
-
94
-
95
-
96
-
97
-
98
-
99
-
100
-
101
-
102
-
103
-
104
-
105
-
106
-
107
-
108
-
109
-
110
-
111
-
112
-
113
-
114
-
115
-
116
-
117
-
118
-
119
-
120
-
121
-
122
-
123
-
124
-
125
-
126
-
127
-
128
-
129
-
130
-
131
-
132
-
133
-
134
-
135
-
136
 |
 |

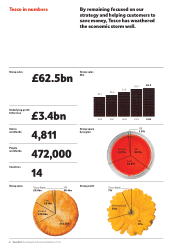
10 Tesco PLC Annual Report and Financial Statements 2010
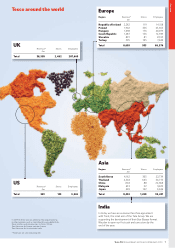
Countries
China
Czech Republic
Hungary
India
Japan
Malaysia
Poland
Republic of Ireland
Slovakia
South Korea
Thailand
Turkey
United States
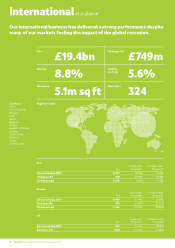
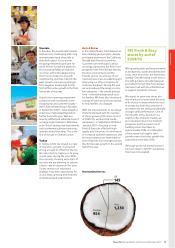
International at a glance
Our international business has delivered a strong performance despite
many of our markets feeling the impact of the global recession.
Sales Trading profit
Regional results
Sales up Trading
profit up
New space 5.1m sq ft
£19.4bn £749m
New stores 324
8.8% 5.6%
Asia
Actual rates Constant rates
£m % growth % growth
Sales (including VAT) 9,072 19.7% 15.3%
Trading profit 440 23.9% 18.9%
Trading margin 5.2% 0.2% 0.2%
Europe
Actual rates Constant rates
£m % growth % growth
Sales (including VAT) 9,997 (0.7)% (0.9)%
Trading profit 474 (4.0)% (5.7)%
Trading margin 5.4% (0.2)% (0.3)%
US
Actual rates Constant rates
£m % growth % growth
Sales (including VAT) 354 72.7% 58.0%
Trading profit (165) (17.9)% (7.9)%