Tesco 2010 Annual Report Download - page 42
Download and view the complete annual report
Please find page 42 of the 2010 Tesco annual report below. You can navigate through the pages in the report by either clicking on the pages listed below, or by using the keyword search tool below to find specific information within the annual report.-
 1
1 -
2
-
3
-
4
-
5
-
6
-
7
-
8
-
9
-
10
-
11
-
12
-
13
-
14
-
15
-
16
-
17
-
18
-
19
-
20
-
21
-
22
-
23
-
24
-
25
-
26
-
27
-
28
-
29
-
30
-
31
-
 32
32 -
 33
33 -
 34
34 -
 35
35 -
 36
36 -
 37
37 -
 38
38 -
 39
39 -
 40
40 -
 41
41 -
 42
42 -
 43
43 -
 44
44 -
 45
45 -
 46
46 -
 47
47 -
 48
48 -
 49
49 -
 50
50 -
 51
51 -
 52
52 -
53
-
54
-
55
-
56
-
57
-
58
-
59
-
60
-
61
-
62
-
63
-
64
-
65
-
66
-
67
-
68
-
69
-
70
-
71
-
72
-
73
-
74
-
75
-
76
-
77
-
78
-
79
-
80
-
81
-
82
-
83
-
84
-
85
-
86
-
87
-
88
-
89
-
90
-
91
-
92
-
93
-
94
-
95
-
96
-
97
-
98
-
99
-
100
-
101
-
102
-
103
-
104
-
105
-
106
-
107
-
108
-
109
-
110
-
111
-
112
-
113
-
114
-
115
-
116
-
117
-
118
-
119
-
120
-
121
-
122
-
123
-
124
-
125
-
126
-
127
-
128
-
129
-
130
-
131
-
132
-
133
-
134
-
135
-
136
 |
 |
40 Tesco PLC Annual Report and Financial Statements 2010
These results are for the 52 weeks ended 27 February 2010. In the
last full financial year, we reported a 53-week period for the UK,
Republic of Ireland and the United States (US) and a 52-week period
for the rest of the Group. Growth rates in these results are expressed
for the UK, Republic of Ireland and US to coincide with the
comparable 52 weeks last year.
Statutory numbers include the adoption of IFRIC 13 (Customer Loyalty
Programmes). All other numbers are shown excluding IFRIC13,
consistent with internal management reporting. More information
can be found in note 1 to the Group financial statements.
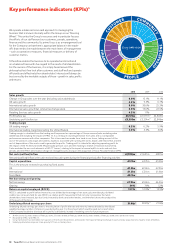
Group sales, including VAT, increased by 6.8% to £62.5bn. At
constant exchange rates, sales increased by 6.1% (including petrol)
and 7.7% (excluding petrol).
Underlying profit before tax rose to £3,395m, an increase of 10.1%.
Group trading profit was £3,412m, up 12.3% on last year and Group
trading margin, at 5.9%, rose 25 basis points. These were helped
by the fact that Tesco Bank was fully consolidated in 2010 and
accounted for as a joint venture for most of 2009.
Group operating profit rose by 10.7% to £3,457m. Group profit
before tax increased 10.4% to £3,176m.
On a statutory 52-week basis (compared to 53 weeks last year),
Group operating profit rose by 9.1% to £3,457m and Group profit
before tax rose by 8.9% to £3,176m.
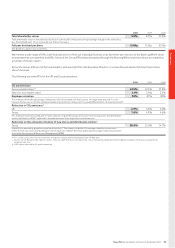
Cash flow and balance sheet Tesco liquidity has improved
significantly during the year through strong cash generation, tight
control of capital expenditure and working capital improvements
arising from better inventory management. Net debt has
consequently reduced by £1.7bn to £7.9bn.
Excluding the effects of currency fluctuations, we expect to reduce
net debt to £7.5bn by the end of the 2010/11 financial year.
The strength of our property-backed balance sheet was
further demonstrated with profitable market-leading sale and
leaseback transactions.
Group capital expenditure was £3.1bn (last year £4.7bn). This reduced
level of spend was achieved whilst still delivering 8% growth in
Group selling space. This year we plan to invest around £3.5bn in
capital expenditure.
Excluding Tesco Bank, cash flow from operating activities totalled
£5.4bn (£5.1bn in 2009), including a £0.6bn improvement in
working capital.
Finance costs and tax Net finance costs, after net favourable IFRS
adjustments of £103m*, reduced to £314m (£356m last year on a
consistent 52-week basis). A reduction in the underlying interest
charge is expected next year. Total Group tax has been charged at
an effective rate of 26.4% (last year 26.7%). We expect the tax rate
in 2010/11 to be around 26%.
Dividend Underlying diluted earnings per share increased by 9.2%
to 16.62p in the second half, calculated using a constant tax rate. The
Board has approved a final dividend of 9.16p per share, taking the full-
year dividend to 13.05p. This represents an increase of 9.1% on last
year’s full-year dividend which is in line with the growth in underlying
diluted earnings per share at constant exchange rates. The final
dividend will be paid on 9 July 2010 to shareholders on the Register
of Members at the close of business on 30 April 2010.
Property We are continuing to release value created through the long-
term development of our property portfolio. In the year we completed
deals with total proceeds of £1.8bn and we expect to divest a similar
amount this year. The strong demand for these assets and the good
yields achieved (initial yields between 5.0% and 5.2% for stores)
demonstrate the strong underlying value of our property and the
strength of the Tesco covenant. Profits from property in the year were
£377m. Our property mix remains strong – over 70% of our property is
freehold – supported by substantial new capital investment in freehold
assets each year. Our latest property assets valuation of £34.6bn
reflects recent firming yields across the market and confirms that our
assets are worth well in excess of their book value.
Pension Our award-winning defined-benefit career-average pension
scheme is an important part of our competitive benefits package,
which helps Tesco recruit and retain the best people. In the UK we have
160,000 employees in the scheme. As at February 2010, under the
IAS19 methodology of pension liability valuation, the scheme had a
deficit on a post-tax basis of £1.3bn, compared to £1.4bn at the half
year. The last actuarial valuation of the scheme’s assets and liabilities
showed a small and manageable deficit.
Return on capital employed We have continued to invest during
the recession, which has put pressure on returns in the short term but
is enabling us to make good progress in all our markets. During the
financial year 2010 our post-tax return on capital employed (ROCE)
fell from 12.8%** to 12.1%.
Having raised ROCE from 10.2% in 2003 to 12.6% in 2006, we
committed in April 2006 to increase ROCE a further 200 basis points
to 14.6%. We are reaffirming this commitment with confidence
that with the prospect of an improving global economy and recent
significant investments in acquisitions and new space making a greater
contribution going forward, returns will improve in the coming few
years, starting in 2010/11.
* £151m benefit from IAS 32 and IAS 39 (Fair value of derivatives) partially offset by
£48m cost as a result of IAS 19 (Pensions).
** In 2009, ROCE on a 52-week comparable basis was 12.7%. On a 53-week basis
it was 12.8% (restated for the impact of IFRIC 13, IFRS 2 and goodwill adjustments).
Group financials