Tesco 2010 Annual Report Download - page 114
Download and view the complete annual report
Please find page 114 of the 2010 Tesco annual report below. You can navigate through the pages in the report by either clicking on the pages listed below, or by using the keyword search tool below to find specific information within the annual report.-
 1
1 -
2
-
3
-
4
-
5
-
6
-
7
-
8
-
9
-
10
-
11
-
12
-
13
-
14
-
15
-
16
-
17
-
18
-
19
-
20
-
21
-
22
-
23
-
24
-
25
-
26
-
27
-
28
-
29
-
30
-
31
-
32
-
33
-
34
-
35
-
36
-
37
-
38
-
39
-
40
-
41
-
42
-
43
-
44
-
45
-
46
-
47
-
48
-
49
-
50
-
51
-
52
-
53
-
54
-
55
-
56
-
57
-
58
-
59
-
60
-
61
-
62
-
63
-
64
-
65
-
66
-
67
-
68
-
69
-
70
-
71
-
72
-
73
-
74
-
75
-
76
-
77
-
78
-
79
-
80
-
81
-
82
-
83
-
84
-
85
-
86
-
87
-
88
-
89
-
90
-
91
-
92
-
93
-
94
-
95
-
96
-
97
-
98
-
99
-
100
-
101
-
102
-
103
-
 104
104 -
 105
105 -
 106
106 -
 107
107 -
 108
108 -
 109
109 -
 110
110 -
 111
111 -
 112
112 -
 113
113 -
 114
114 -
 115
115 -
 116
116 -
 117
117 -
 118
118 -
 119
119 -
 120
120 -
 121
121 -
 122
122 -
 123
123 -
 124
124 -
125
-
126
-
127
-
128
-
129
-
130
-
131
-
132
-
133
-
134
-
135
-
136
 |
 |

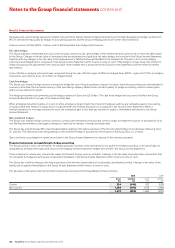
Notes to the Group financial statements continued
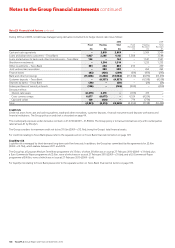
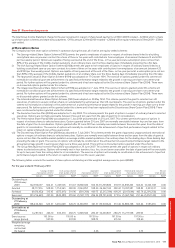
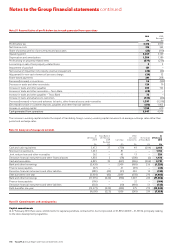
Note 27 Share-based payments continued
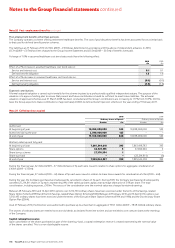
For the year ended 28 February 2009
Savings-related Irish savings-related Approved Unapproved International executive Nil cost
share option scheme share option scheme share option scheme share option scheme share option scheme share options
Options WAEP Options WAEP Options WAEP Options WAEP Options WAEP Options WAEP
Outstanding at
23 February
2008 153,361,820 281.40 5,083,009 300.71 16,229,846 324.45 77,043,605 307.00 36,970,259 333.22 10,838,238 0.00
Granted 38,531,375 311.00 1,642,089 311.00 3,308,213 426.79 18,297,370 426.82 13,664,591 422.88 3,591,855 0.00
Forfeited (10,351,962) 299.64 (485,512) 293.84 (901,163) 384.34 (2,768,871) 388.51 (3,268,614) 327.65 – –
Exercised (38,731,136) 214.48 (820,683) 226.80 (2,767,976) 277.55 (11,272,220) 243.72 (3,468,031) 269.07 (106,385) 0.00
Outstanding at
28 February
2009 142,810,097 306.21 5,418,903 315.67 15,868,920 350.56 81,299,884 339.97 43,898,205 366.61 14,323,708 0.00
Exercisable as at
28 February
2009 6,553,484 220.72 398,093 233.61 5,574,827 259.54 36,205,357 260.09 12,340,929 268.72 2,048,225 0.00
Exercise price 159.00 to 159.00 to 197.50 to 164.00 to 176.70 to
range (pence) 248.00 248.00 313.50 313.50 312.75 0.00
Weighted average
remaining
contractual
life (years) 0.18 0.15 3.99 4.63 4.76 5.83
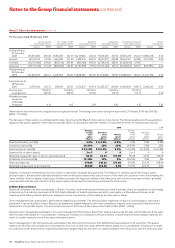
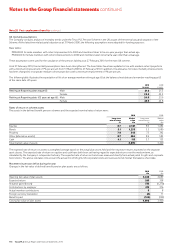
Share options were exercised on a regular basis throughout the year. The average share price during the year ended 27 February 2010 was 380.05p
(2009 – 372.06p).
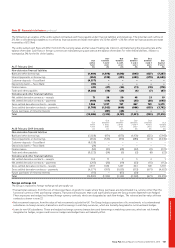
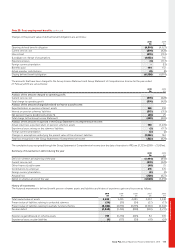
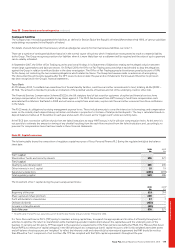
The fair value of share options is estimated at the date of grant using the Black-Scholes option pricing model. The following table gives the assumptions
applied to the options granted in the respective periods shown. No assumption has been made to incorporate the effects of expected early exercise.
2010 2009
Savings- Savings-
related Executive related Executive
share share Nil cost share share Nil cost
option option option option option option
schemes schemes schemes schemes schemes schemes
Expected dividend yield (%) 3.6% 3.6-3.9% 0.0% 3.3% 3.3% 0.0%
Expected volatility (%) 26-31% 25% 25% 25-30% 25% 25%
Risk-free interest rate (%) 2.0-2.8% 2.8-3.3% 2.9% 3.2-3.8% 3.2-4.9% 4.6-4.9%
Expected life of option (years) 3 or 5 6 6 3 or 5 6 6
Weighted average fair value of options granted (pence) 86.74 64.24 374.00 89.28 93.90 418.09
Probability of forfeiture (%) 14-16% 10% 0% 20-25% 10% 0%
Share price (pence) 378.00 345.23 374.00 361.00 425.20 418.09
Weighted average exercise price (pence) 328.00 338.58 0.00 311.00 425.20 0.00
Volatility is a measure of the amount by which a price is expected to fluctuate during a period. The measure of volatility used in the Group’s option
pricing models is the annualised standard deviation of the continuously compounded rates of return on the share over a period of time. In estimating the
future volatility of the Company’s share price, the Board considers the historical volatility of the share price over the most recent period that is generally
commensurate with the expected term of the option, taking into account the remaining contractual life of the option.
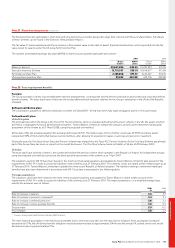
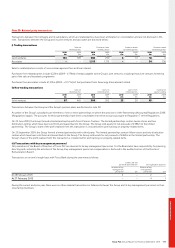
b) Share bonus schemes
Eligible UK employees are able to participate in Shares in Success, an all-employee profit-sharing scheme. Each year, shares are awarded as a percentage
of earnings up to a statutory maximum of £3,000. Eligible Republic of Ireland employees are able to participate in a Share Bonus Scheme, an all-
employee profit sharing scheme. Each year, employees receive a percentage of their earnings as either cash or shares.
Senior management also participate in performance-related bonus schemes. The amount paid to employees is based on a percentage of salary and is
paid partly in cash and partly in shares. Bonuses are awarded to eligible employees who have completed a required service period and depend on the
achievement of corporate targets. The accrued cash element of the bonus at the balance sheet date is £52m (2009 – £33m).
Selected senior management participate in the senior management Performance Share Plan. Awards made under this plan will normally vest three years
after the date of the award for nil consideration. Vesting will normally be conditional on the achievement of specified performance targets related to the
return on capital employed over a three year performance period.
Senior management in the US business also participate in the US Long-Term Incentive Plan (2007) which was adopted on 29 June 2007. The awards
made under this Plan will normally vest in four tranches: four, five, six and seven years after the date of award, for nil consideration. Vesting will normally
be conditional on the achievement of specified performance targets related to the return on capital employed in the US business over the seven-year plan.
112 Tesco PLC Annual Report and Financial Statements 2010