Tesco 2010 Annual Report Download - page 84
Download and view the complete annual report
Please find page 84 of the 2010 Tesco annual report below. You can navigate through the pages in the report by either clicking on the pages listed below, or by using the keyword search tool below to find specific information within the annual report.-
 1
1 -
2
-
3
-
4
-
5
-
6
-
7
-
8
-
9
-
10
-
11
-
12
-
13
-
14
-
15
-
16
-
17
-
18
-
19
-
20
-
21
-
22
-
23
-
24
-
25
-
26
-
27
-
28
-
29
-
30
-
31
-
32
-
33
-
34
-
35
-
36
-
37
-
38
-
39
-
40
-
41
-
42
-
43
-
44
-
45
-
46
-
47
-
48
-
49
-
50
-
51
-
52
-
53
-
54
-
55
-
56
-
57
-
58
-
59
-
60
-
61
-
62
-
63
-
64
-
65
-
66
-
67
-
68
-
69
-
70
-
71
-
72
-
73
-
 74
74 -
 75
75 -
 76
76 -
 77
77 -
 78
78 -
 79
79 -
 80
80 -
 81
81 -
 82
82 -
 83
83 -
 84
84 -
 85
85 -
 86
86 -
 87
87 -
 88
88 -
 89
89 -
 90
90 -
 91
91 -
 92
92 -
 93
93 -
 94
94 -
95
-
96
-
97
-
98
-
99
-
100
-
101
-
102
-
103
-
104
-
105
-
106
-
107
-
108
-
109
-
110
-
111
-
112
-
113
-
114
-
115
-
116
-
117
-
118
-
119
-
120
-
121
-
122
-
123
-
124
-
125
-
126
-
127
-
128
-
129
-
130
-
131
-
132
-
133
-
134
-
135
-
136
 |
 |

Notes to the Group financial statements continued
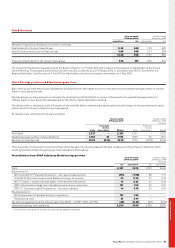
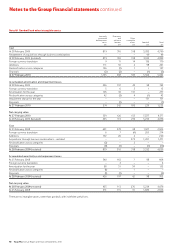
Note 2 Segmental reporting
IFRS 8 requires operating segments to be determined based on the Group’s internal reporting to the Chief Operating Decision Maker (‘CODM’).
The CODM has been determined to be the Executive Committee of the Board of Directors as it is primarily responsible for the allocation of resources
to segments and the assessment of performance of the segments. Previously, segments were determined and presented in accordance with IAS 14
‘Segment Reporting’.
The CODM uses trading profit, as reviewed at monthly Executive Committee meetings as the key measure of the segments’ results as it reflects the
segments’ underlying trading performance for the period under evaluation. Trading profit is a consistent measure within the Group.
Segmental trading profit is an adjusted measure of operating profit, which measures the performance of each segment before exceptional items
(goodwill impairment and restructuring charges), profit arising on property-related items, impact on leases of annual uplifts in rent and rent-free periods,
amortisation charges from intangible assets arising on acquisition, adjustments to fair value of customer loyalty awards and replaces the IAS 19 pension
charge with the ‘normal’ cash contributions for pensions.
On the adoption of IFRS 8, the Group revised its operating and reporting segments. The Group’s operating segments were previously defined
geographically – UK, Rest of Europe, Asia and US. The Group’s operations (retail and retailing services) are managed by geography, with Tesco Bank
as a separate reporting segment because of its different regulatory environment. Accordingly, the segments under IFRS 8 are UK, Rest of Europe (ROE
comprises Republic of Ireland, Hungary, Poland, the Czech Republic, Slovakia and Turkey), Asia (comprising Thailand, South Korea, Malaysia, China,
Japan and India), US and Tesco Bank.
Comparative information has been restated to reflect these new segments.
Segment assets include items directly attributable to a segment as well as those that can be allocated on a reasonable basis. Unallocated is comprised
mainly of derivative receivables, interest-bearing loan receivables and taxation-related assets.
Inter-segment turnover between the operating segments is not material.
The segment results for the year ended 27 February 2010, for the year ended 28 February 2009 and the reconciliation of the segment measures to the
respective statutory items included in the consolidated financial information are as follows:
Total at Total
Tesco constant Foreign at actual
Year ended 27 February 2010 UK ROE Asia US Bank exchange exchange exchange
At constant exchange rates £m £m £m £m £m £m £m £m
Continuing operations
Sales inc. VAT (excluding IFRIC 13) 42,254 9,979 8,737 324 860 62,154 383 62,537
Revenue (excluding IFRIC 13) 39,104 8,704 8,148 319 860 57,135 367 57,502
Effect of IFRIC 13 (546) (19) (25) – – (590) (2) (592)
Revenue 38,558 8,685 8,123 319 860 56,545 365 56,910
Trading profit/(loss) 2,413 466 422 (151) 250 3,400 12 3,412
Trading margin* 6.2% 5.4% 5.2% (47.3%) 29.1% 5.9% – 5.9%
Total
Tesco at actual
Year ended 27 February 2010 UK ROE Asia US Bank exchange
At actual exchange rates £m £m £m £m £m £m
Continuing operations
Sales inc. VAT (excluding IFRIC 13) 42,254 9,997 9,072 354 860 62,537
Revenue (excluding IFRIC 13) 39,104 8,724 8,465 349 860 57,502
Effect of IFRIC 13 (546) (20) (26) – – (592)
Revenue 38,558 8,704 8,439 349 860 56,910
Trading profit/(loss) 2,413 474 440 (165) 250 3,412
Trading margin* 6.2% 5.4% 5.2% (47.3%) 29.1% 5.9%
Total at Total
Tesco constant Foreign at actual
Year ended 28 February 2009 UK ROE Asia US Bank exchange exchange exchange
At constant exchange rates £m £m £m £m £m £m £m £m
Continuing operations
Sales inc. VAT (excluding IFRIC 13) 41,357 8,373 7,020 181 163 57,094 2,332 59,426
Revenue (excluding IFRIC 13) 38,028 7,335 6,552 179 163 52,257 2,070 54,327
Effect of IFRIC 13 (378) (26) (18) – – (422) (7) (429)
Revenue 37,650 7,309 6,534 179 163 51,835 2,063 53,898
Trading profit/(loss) 2,309 411 345 (123) 68 3,010 76 3,086
Trading margin* 6.1% 5.6% 5.3% (68.7%) 41.7% 5.8% 5.7%
* Trading margin is based on revenue excluding IFRIC 13.
82 Tesco PLC Annual Report and Financial Statements 2010