Tesco 2010 Annual Report Download - page 90
Download and view the complete annual report
Please find page 90 of the 2010 Tesco annual report below. You can navigate through the pages in the report by either clicking on the pages listed below, or by using the keyword search tool below to find specific information within the annual report.-
 1
1 -
2
-
3
-
4
-
5
-
6
-
7
-
8
-
9
-
10
-
11
-
12
-
13
-
14
-
15
-
16
-
17
-
18
-
19
-
20
-
21
-
22
-
23
-
24
-
25
-
26
-
27
-
28
-
29
-
30
-
31
-
32
-
33
-
34
-
35
-
36
-
37
-
38
-
39
-
40
-
41
-
42
-
43
-
44
-
45
-
46
-
47
-
48
-
49
-
50
-
51
-
52
-
53
-
54
-
55
-
56
-
57
-
58
-
59
-
60
-
61
-
62
-
63
-
64
-
65
-
66
-
67
-
68
-
69
-
70
-
71
-
72
-
73
-
74
-
75
-
76
-
77
-
78
-
79
-
 80
80 -
 81
81 -
 82
82 -
 83
83 -
 84
84 -
 85
85 -
 86
86 -
 87
87 -
 88
88 -
 89
89 -
 90
90 -
 91
91 -
 92
92 -
 93
93 -
 94
94 -
 95
95 -
 96
96 -
 97
97 -
 98
98 -
 99
99 -
 100
100 -
101
-
102
-
103
-
104
-
105
-
106
-
107
-
108
-
109
-
110
-
111
-
112
-
113
-
114
-
115
-
116
-
117
-
118
-
119
-
120
-
121
-
122
-
123
-
124
-
125
-
126
-
127
-
128
-
129
-
130
-
131
-
132
-
133
-
134
-
135
-
136
 |
 |

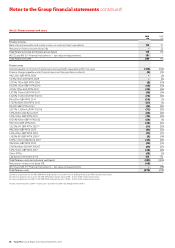
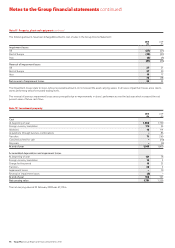
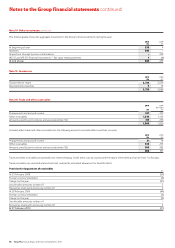
Notes to the Group financial statements continued
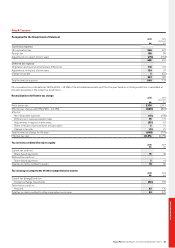
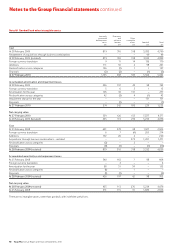
Note 6 Taxation continued
Deferred tax
The following are the major deferred tax assets/(liabilities) recognised by the Group and movements thereon during the current and prior year:
Other
Accelerated Retirement Short-term pre/post
tax benefit Share-based timing IAS 32 and tax temporary
depreciation obligation payments differences Tax losses IAS 39 differences Total
£m £m £m £m £m £m £m £m
At 23 February 2008 (restated) (1,068) 233 76 36 12 13 11 (687)
(Charge)/credit to the
Group Income Statement (194) 7 (46) 70 1 (8) (12) (182)
Credit directly to equity – – 14 – – – – 14
Credit to other comprehensive income – 176 – – – – – 176
Acquisition of subsidiaries 12 – – (14) – 42 – 40
Foreign exchange translation 3 1 – (2) 3 – 7 12
At 28 February 2009 (restated) (1,247) 417 44 90 16 47 6 (627)
(Charge)/credit to the
Group Income Statement (257) 7 9 (7) 21 (11) 1 (237)
Credit directly to equity – – 3 – – – – 3
Credit to other comprehensive income – 87 – – – – – 87
Acquisition of subsidiaries – – – – 2 – – 2
Foreign exchange and other movements 8 – – 8 2 – (3) 15
At 27 February 2010 (1,496) 511 56 91 41 36 4 (757)
Certain deferred tax assets and liabilities have been offset. The following is the analysis of the deferred tax balances (after offset) for financial
reporting purposes:
2010 2009
Restated
£m £m
Deferred tax assets 38 49
Deferred tax liabilities (795) (676)
(757) (627)
The impact of adopting IFRIC 13 on the 2009 opening balance sheet was an £11m reduction in deferred tax liabilities.
No deferred tax is recognised on the unremitted earnings of overseas subsidiaries and joint ventures, because the earnings are continually reinvested by
the Group and no tax is expected to be payable on them in the foreseeable future. The temporary difference unrecognised at the year end amounted to
£2,766m (2009 – £1,726m). Furthermore the introduction of a dividend exemption in the UK tax legislation with effect from 1 July 2009 means that
earnings can be remitted from certain subsidiary undertakings where no tax will be payable on repatriation.
Unrecognised deferred tax assets
Deferred tax assets have not been recognised in respect of the following items (because it is not probable that future taxable profits will be available
against which the Group can utilise the benefits):
2010 2009
£m £m
Deductible temporary differences 1 12
Tax losses 286 192
287 204
As at 27 February 2010, the Group has unused trading tax losses of £1,019m (2009 – £744m) available for offset against future profits. A deferred tax
asset has been recognised in respect of £142m (2009 – £58m) of such losses. No deferred tax asset has been recognised in respect of the remaining
£877m (2009 – £686m) due to the unpredictability of future profit streams. Included in unrecognised tax losses are losses of £297m (2009 – £32m in
2013) that will expire in 2014 and £550m (2009 – £647m between 2014 and 2029) that will expire between 2015 and 2030. Other losses will be carried
forward indefinitely.
In addition, the Group has UK capital losses of £342m (2009 – £310m) in respect of which no deferred tax asset has been recognised.
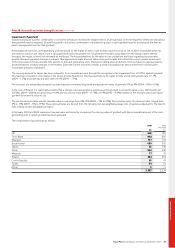
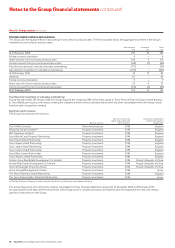
Note 7 Non-current assets classified as held for sale
2010 2009
£m £m
Non-current assets classified as held for sale 373 398
The non-current assets classified as held for sale consist mainly of properties in the United Kingdom due to be sold within one year.
88 Tesco PLC Annual Report and Financial Statements 2010