Tesco 2010 Annual Report Download - page 117
Download and view the complete annual report
Please find page 117 of the 2010 Tesco annual report below. You can navigate through the pages in the report by either clicking on the pages listed below, or by using the keyword search tool below to find specific information within the annual report.-
 1
1 -
2
-
3
-
4
-
5
-
6
-
7
-
8
-
9
-
10
-
11
-
12
-
13
-
14
-
15
-
16
-
17
-
18
-
19
-
20
-
21
-
22
-
23
-
24
-
25
-
26
-
27
-
28
-
29
-
30
-
31
-
32
-
33
-
34
-
35
-
36
-
37
-
38
-
39
-
40
-
41
-
42
-
43
-
44
-
45
-
46
-
47
-
48
-
49
-
50
-
51
-
52
-
53
-
54
-
55
-
56
-
57
-
58
-
59
-
60
-
61
-
62
-
63
-
64
-
65
-
66
-
67
-
68
-
69
-
70
-
71
-
72
-
73
-
74
-
75
-
76
-
77
-
78
-
79
-
80
-
81
-
82
-
83
-
84
-
85
-
86
-
87
-
88
-
89
-
90
-
91
-
92
-
93
-
94
-
95
-
96
-
97
-
98
-
99
-
100
-
101
-
102
-
103
-
104
-
105
-
106
-
 107
107 -
 108
108 -
 109
109 -
 110
110 -
 111
111 -
 112
112 -
 113
113 -
 114
114 -
 115
115 -
 116
116 -
 117
117 -
 118
118 -
 119
119 -
 120
120 -
 121
121 -
 122
122 -
 123
123 -
 124
124 -
 125
125 -
 126
126 -
 127
127 -
128
-
129
-
130
-
131
-
132
-
133
-
134
-
135
-
136
 |
 |

Financial statements
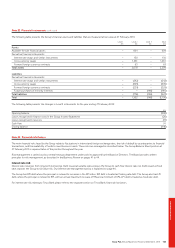
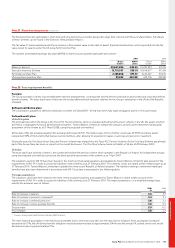
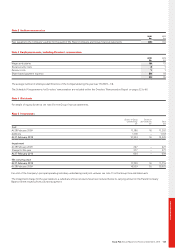
Note 28 Post-employment benefits continued
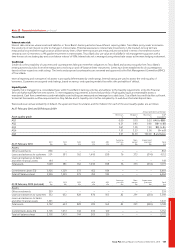
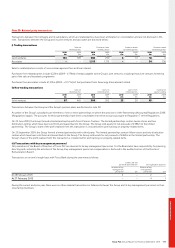
Changes in the present value of defined benefit obligations are as follows:
2010 2009
£m £m
Opening defined benefit obligation (4,914) (4,927)
Current service cost (391) (428)
Interest cost (313) (313)
(Loss)/gain on change of assumptions (1,052) 760
Experience losses (1) (117)
Foreign currency translation – (13)
Benefits paid 144 132
Actual member contributions (9) (8)
Closing defined benefit obligation (6,536) (4,914)
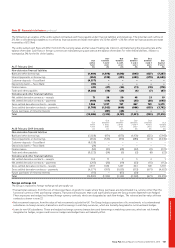
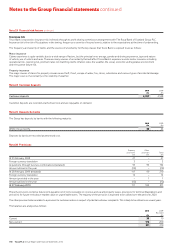
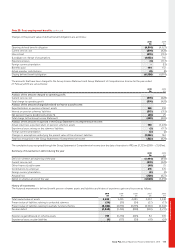
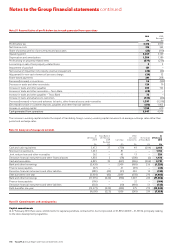
The amounts that have been charged to the Group Income Statement and Group Statement of Comprehensive Income for the year ended
27 February 2010 are set out below:
2010 2009
£m £m
Analysis of the amount charged to operating profit:
Current service cost (391) (428)
Total charge to operating profit (391) (428)
Analysis of the amount (charged)/credited to finance (cost)/income:
Expected return on pension schemes’ assets 265 338
Interest on pension schemes’ liabilities (313) (313)
Net pension finance (cost)/income (note 5) (48) 25
Total charge to the Group Income Statement (439) (403)
Analysis of the amount recognised in the Group Statement of Comprehensive Income:
Actual return less expected return on pension schemes’ assets 733 (1,270)
Experience losses arising on the schemes’ liabilities (1) (117)
Foreign currency translation (2) (2)
Changes in assumptions underlying the present value of the schemes’ liabilities (1,052) 760
Total loss recognised in the Group Statement of Comprehensive Income (322) (629)
The cumulative losses recognised through the Group Statement of Comprehensive Income since the date of transition to IFRS are £1,323m (2009 – £1,001m).
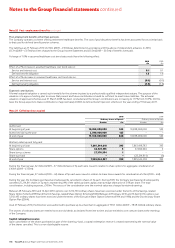
Summary of movements in deficit during the year
2010 2009
£m £m
Deficit in schemes at beginning of the year (1,494) (838)
Current service cost (391) (428)
Other finance (cost)/income (48) 25
Contributions by employer 415 376
Foreign currency translation (2) (2)
Actuarial loss (320) (627)
Deficit in schemes at end of the year (1,840) (1,494)
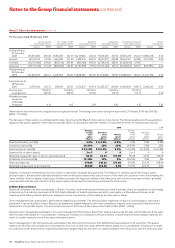
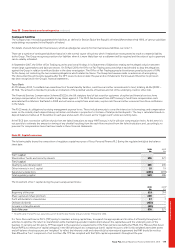
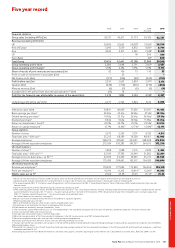
History of movements
The historical movement in defined benefit pension schemes assets and liabilities and history of experience gains and losses are as follows:
2010 2009 2008 2007 2006
£m £m £m £m £m
Total market value of assets 4,696 3,420 4,089 4,007 3,448
Present value of liabilities relating to unfunded schemes (54) (39) (34) (27) (17)
Present value of liabilities relating to partially funded schemes (6,482) (4,875) (4,893) (4,930) (4,642)
Pension deficit (1,840) (1,494) (838) (950) (1,211)
Experience gains/(losses) on scheme assets 733 (1,270) (465) 82 309
Experience losses on plan liabilities (1) (117) (20) (41) (24)
Tesco PLC Annual Report and Financial Statements 2010 115