Tesco 2010 Annual Report Download - page 88
Download and view the complete annual report
Please find page 88 of the 2010 Tesco annual report below. You can navigate through the pages in the report by either clicking on the pages listed below, or by using the keyword search tool below to find specific information within the annual report.-
 1
1 -
2
-
3
-
4
-
5
-
6
-
7
-
8
-
9
-
10
-
11
-
12
-
13
-
14
-
15
-
16
-
17
-
18
-
19
-
20
-
21
-
22
-
23
-
24
-
25
-
26
-
27
-
28
-
29
-
30
-
31
-
32
-
33
-
34
-
35
-
36
-
37
-
38
-
39
-
40
-
41
-
42
-
43
-
44
-
45
-
46
-
47
-
48
-
49
-
50
-
51
-
52
-
53
-
54
-
55
-
56
-
57
-
58
-
59
-
60
-
61
-
62
-
63
-
64
-
65
-
66
-
67
-
68
-
69
-
70
-
71
-
72
-
73
-
74
-
75
-
76
-
77
-
 78
78 -
 79
79 -
 80
80 -
 81
81 -
 82
82 -
 83
83 -
 84
84 -
 85
85 -
 86
86 -
 87
87 -
 88
88 -
 89
89 -
 90
90 -
 91
91 -
 92
92 -
 93
93 -
 94
94 -
 95
95 -
 96
96 -
 97
97 -
 98
98 -
99
-
100
-
101
-
102
-
103
-
104
-
105
-
106
-
107
-
108
-
109
-
110
-
111
-
112
-
113
-
114
-
115
-
116
-
117
-
118
-
119
-
120
-
121
-
122
-
123
-
124
-
125
-
126
-
127
-
128
-
129
-
130
-
131
-
132
-
133
-
134
-
135
-
136
 |
 |

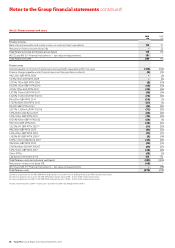
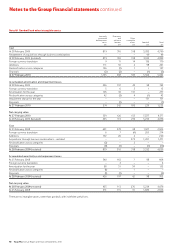
Notes to the Group financial statements continued
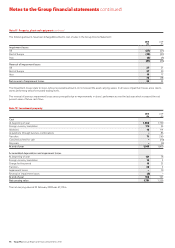
Note 5 Finance income and costs
2010 2009
£m £m
Finance income
Bank interest receivable and similar income on cash and cash equivalents 114 91
Net pension finance income (note 28) – 25
Total finance income (on historical cost basis) 114 116
IAS 32 and IAS 39 ‘Financial Instruments’ – fair value remeasurements 151 –
Total finance income 265 116
Finance costs
Interest payable on short-term bank loans and overdrafts repayable within five years (135) (152)
Finance charges payable under finance leases and hire purchase contracts (9) (13)
6% 125m GBP MTN 2008 – (2)
5.25% 500m EUR MTN 2008 – (4)
5.125% 192m GBP MTN 2009 (8) (10)
6.625% 150m GBP MTN 2010 (10) (10)
4.75% 750m EUR MTN 2010 (25) (26)
3.875% 500m EUR MTN 2011 (13) (14)
5.625% 1,500m EUR MTN 2012 (74) (35)
5% 600m GBP MTN 2014 (30) (1)
5.125% 600m EUR MTN 2015 (27) (1)
4% RPI GBP MTN 2016(a) (12) (23)
5.875% 1,500m EUR MTN 2016 (72) (33)
5.5% 850m USD Bond 2017 (23) (23)
5.5% 350m GBP MTN 2019 (19) (20)
6.125% 900m GBP MTN 2022 (55) (1)
5% 515m GBP MTN 2023 (26) (21)
3.322% LPI GBP MTN 2025(b) (11) (20)
6% 200m GBP MTN 2029 (12) (12)
5.5% 200m GBP MTN 2033 (11) (11)
1.982% RPI GBP MTN 2036(c) (5) (14)
6.15% 1,150m USD Bond 2037 (34) (35)
5% 300m GBP MTN 2042 (15) (15)
5.125% 600m EUR MTN 2047 (21) (21)
5.2% 500m GBP MTN 2057 (26) (26)
Other MTNs (13) (9)
Capitalised interest (note 11) 155 152
Total finance costs (on historical cost basis) (531) (400)
Net pension finance cost (note 28) (48) –
IAS 32 and IAS 39 ‘Financial Instruments’ – fair value remeasurements – (78)
Total finance costs (579) (478)
(a) Interest payable on the 4% RPI GBP MTN 2016 includes £1m (2009 – £13m) of Retail Price Index (RPI) related amortisation.
(b) Interest payable on the 3.322% LPI GBP MTN 2025 includes £2m (2009 – £11m) of RPI related amortisation.
(c) Interest payable on the 1.982% RPI GBP MTN 2036 includes £1m (2009 – £10m) of RPI related amortisation.
Finance income of £20m (2009 – finance costs of £30m) resulted from hedge ineffectiveness.
86 Tesco PLC Annual Report and Financial Statements 2010