Tesco 2010 Annual Report Download - page 62
Download and view the complete annual report
Please find page 62 of the 2010 Tesco annual report below. You can navigate through the pages in the report by either clicking on the pages listed below, or by using the keyword search tool below to find specific information within the annual report.-
 1
1 -
2
-
3
-
4
-
5
-
6
-
7
-
8
-
9
-
10
-
11
-
12
-
13
-
14
-
15
-
16
-
17
-
18
-
19
-
20
-
21
-
22
-
23
-
24
-
25
-
26
-
27
-
28
-
29
-
30
-
31
-
32
-
33
-
34
-
35
-
36
-
37
-
38
-
39
-
40
-
41
-
42
-
43
-
44
-
45
-
46
-
47
-
48
-
49
-
50
-
51
-
 52
52 -
 53
53 -
 54
54 -
 55
55 -
 56
56 -
 57
57 -
 58
58 -
 59
59 -
 60
60 -
 61
61 -
 62
62 -
 63
63 -
 64
64 -
 65
65 -
 66
66 -
 67
67 -
 68
68 -
 69
69 -
 70
70 -
 71
71 -
 72
72 -
73
-
74
-
75
-
76
-
77
-
78
-
79
-
80
-
81
-
82
-
83
-
84
-
85
-
86
-
87
-
88
-
89
-
90
-
91
-
92
-
93
-
94
-
95
-
96
-
97
-
98
-
99
-
100
-
101
-
102
-
103
-
104
-
105
-
106
-
107
-
108
-
109
-
110
-
111
-
112
-
113
-
114
-
115
-
116
-
117
-
118
-
119
-
120
-
121
-
122
-
123
-
124
-
125
-
126
-
127
-
128
-
129
-
130
-
131
-
132
-
133
-
134
-
135
-
136
 |
 |

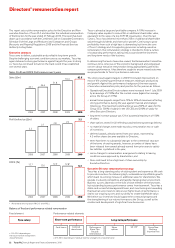
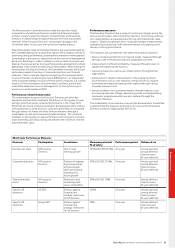
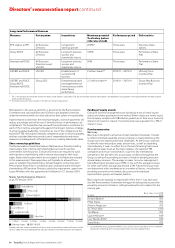
Directors’ remuneration report continued
Table 4 Share options held by Directors and not exercised at 27 February 2010 continued
Executive Share Option Schemes (1994) and (1996) and Discretionary Share Option Plan (2004)
Options as at Options Options Options as at Exercise Date from
28 February granted exercised 27 February price which Expiry
Date of grant 2009 in year1 in year2 2010 (pence) exercisable date
Sir Terry Leahy 30.11.1999 228,901 – 228,901 – 173.00 30.11.2002 30.11.2009
20.04.2000 17,673 – 17,673 – 209.50 20.04.2003 20.04.2010
26.06.2000 780,487 – 780,487 – 205.00 26.06.2003 26.06.2010
26.04.2001 647,773 – – 647,773 247.00 26.04.2004 26.04.2011
15.04.2002 642,471 – – 642,471 259.00 15.04.2005 15.04.2012
14.04.2003 939,747 – – 939,747 197.50 14.04.2006 14.04.2013
30.04.2004 766,041 – – 766,041 253.25 30.04.2007 30.04.2014
22.04.2005 658,673 – – 658,673 312.75 22.04.2008 22.04.2015
08.05.2006 709,353 – – 709,353 318.60 08.05.2009 08.05.2016
08.05.2007 523,556 – – 523,556 473.75 08.05.2010 08.05.2017
12.05.2008 618,548 – – 618,548 427.00 12.05.2011 12.05.2018
06.05.2009 – 812,647 – 812,647 338.40 06.05.2012 06.05.2019
Total 6,533,223 812,647 1,027,061 6,318,809
Tim Mason 15.04.2002 358,301 – 358,301 – 259.00 15.04.2005 15.04.2012
30.04.2004 434,353 – 434,353 – 253.25 30.04.2007 30.04.2014
22.04.2005 379,856 – 379,856 – 312.75 22.04.2008 22.04.2015
08.05.2006 404,896 – 404,896 – 318.60 08.05.2009 08.05.2016
10.08.2007 333,319 – – 333,319 424.75 10.08.2010 10.08.2017
12.05.2008 353,114 – – 353,114 427.00 12.05.2011 12.05.2018
06.05.2009 – 467,848 – 467,848 338.40 06.05.2012 06.05.2019
Total 2,263,839 467,848 1,577,406 1,154,281
Laurie McIlwee2 22.04.2005 105,500 – 105,500 – 312.75 22.04.2008 22.04.2015
08.05.2006 108,286 – 108,286 – 318.60 08.05.2009 08.05.2016
08.05.2007 77,192 – – 77,192 473.75 08.07.2010 08.05.2017
12.05.2008 91,335 – – 91,335 427.00 12.05.2011 12.05.2018
06.05.2009 – 325,059 – 325,059 338.40 06.05.2012 06.05.2019
Total 382,313 325,059 213,786 493,586
Lucy Neville-Rolfe 22.04.2005 108,050 – 108,050 – 312.75 22.04.2008 22.04.2015
08.05.2006 116,133 – 116,133 – 318.60 08.05.2009 08.05.2016
08.05.2007 189,973 – – 189,973 473.75 08.05.2010 08.05.2017
12.05.2008 231,850 – – 231,850 427.00 12.05.2011 08.05.2018
06.05.2009 – 327,494 – 327,494 338.40 06.05.2012 06.05.2019
Total 646,006 327,494 224,183 749,317
David Potts 22.04.2005 379,856 – 379,856 312.75 22.04.2008 22.04.2015
08.05.2006 404,896 – – 404,896 318.60 08.05.2009 08.05.2016
08.05.2007 298,844 – – 298,844 473.75 08.05.2010 08.05.2017
12.05.2008 353,114 – – 353,114 427.00 12.05.2011 12.05.2018
06.05.2009 – 467,848 – 467,848 338.40 06.05.2012 06.05.2019
Total 1,436,710 467,848 – 1,904,558
Total 16,558,925 3,804,440 4,834,109 15,529,256
1 Executive share options are subject to performance conditions measured over three years as set out on page 56. EPS growth for the period 2006/7 to 2008/9 exceeded RPI by 31%,
therefore share options awarded on 8 May 2006 vested in full on 8 May 2009. Executives have until the tenth anniversary of the date of grant to exercise their options.
2 The market price at exercise is shown in Table 3. The share price as at 27 February 2010 was 420.00p. The share price during the 52 weeks to 27 February 2010 ranged from
301.40p to 437.05p.
60 Tesco PLC Annual Report and Financial Statements 2010