Seagate 2015 Annual Report Download - page 51
Download and view the complete annual report
Please find page 51 of the 2015 Seagate annual report below. You can navigate through the pages in the report by either clicking on the pages listed below, or by using the keyword search tool below to find specific information within the annual report.-
 1
1 -
2
-
3
-
4
-
5
-
6
-
7
-
8
-
9
-
10
-
11
-
12
-
13
-
14
-
15
-
16
-
17
-
18
-
19
-
20
-
21
-
22
-
23
-
24
-
25
-
26
-
27
-
28
-
29
-
30
-
31
-
32
-
33
-
34
-
35
-
36
-
37
-
38
-
39
-
40
-
 41
41 -
 42
42 -
 43
43 -
 44
44 -
 45
45 -
 46
46 -
 47
47 -
 48
48 -
 49
49 -
 50
50 -
 51
51 -
 52
52 -
 53
53 -
 54
54 -
 55
55 -
 56
56 -
 57
57 -
 58
58 -
 59
59 -
 60
60 -
 61
61 -
62
-
63
-
64
-
65
-
66
-
67
-
68
-
69
-
70
-
71
-
72
-
73
-
74
-
75
-
76
-
77
-
78
-
79
-
80
-
81
-
82
-
83
-
84
-
85
-
86
-
87
-
88
-
89
-
90
-
91
-
92
-
93
-
94
-
95
-
96
-
97
-
98
-
99
-
100
-
101
-
102
-
103
-
104
-
105
-
106
-
107
-
108
-
109
-
110
-
111
-
112
-
113
-
114
-
115
-
116
-
117
-
118
-
119
-
120
-
121
-
122
-
123
-
124
-
125
-
126
-
127
-
128
-
129
-
130
-
131
-
132
-
133
-
134
-
135
-
136
-
137
-
138
-
139
-
140
-
141
-
142
-
143
-
144
-
145
-
146
-
147
-
148
-
149
-
150
-
151
-
152
-
153
-
154
-
155
 |
 |

TableofContents
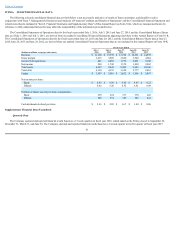
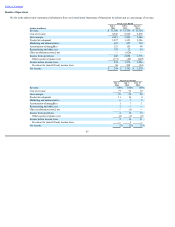
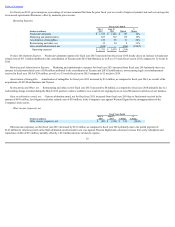
Thefollowingtablesummarizesinformationregardingaveragedrivesellingprices("ASPs")excludingstoragesystems;drivevolumeshipments,exabytes
shipped,andrevenuesbychannelandgeography:
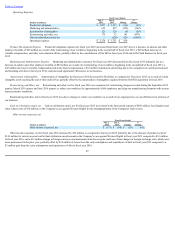
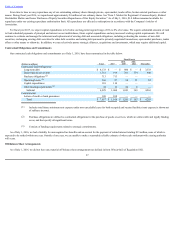
FiscalYear2016ComparedtoFiscalYear2015
Revenue
Revenueinfiscalyear2016decreasedapproximately19%or$2.6billion,fromfiscalyear2015,asaresultofadecreaseinshipmentsby43millionunitsand
priceerosion,whichwereduetolowerdemandintheclientcomputemarketandreduceddemandformissioncriticalHDDenterpriseproducts,partiallyoffsetby
improvedproductmix.
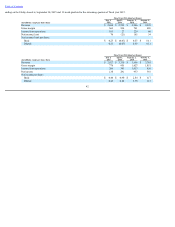
CostofRevenueandGrossMargin
Forfiscalyear2016,grossmarginasapercentageofrevenuedecreasedby500basispointscomparedtothepriorfiscalyearduetopriceerosionandreduced
demandinlegacyharddrivesresultinginunderutilizationofcertainfactories,partiallyoffsetbyimprovedproductmixinthesecondhalfoffiscalyear2016.
48
FiscalYearsEnded
(Inmillions,exceptpercentages,exabytesandASPs)
July1,
2016
July3,
2015
June27,
2014
UnitShipments:
Enterprise 32 36 31
ClientCompute 93 132 144
ClientNon-Compute 44 44 45
TotalUnitsShipped 169 212 220
ASPs(perunit) $ 61 $ 61 $ 61
ExabytesShipped 233 228 202
RevenuesbyChannel(%)
OEMs 70% 71% 68%
Distributors 16% 17% 20%
Retailers 14% 12% 12%
RevenuesbyGeography(%)
Americas 29% 28% 27%
EMEA 17% 17% 19%
AsiaPacific 54% 55% 54%
FiscalYearsEnded
(Dollarsinmillions)
July1,
2016
July3,
2015 Change
%
Change
Revenue $ 11,160 $ 13,739 $ (2,579) (19)%
FiscalYearsEnded
(Dollarsinmillions)
July1,
2016
July3,
2015 Change
%
Change
Costofrevenue $ 8,545 $ 9,930 $ (1,385) (14)%
Grossmargin $ 2,615 $ 3,809 $ (1,194) (31)%
Grossmarginpercentage 23% 28%