Seagate 2015 Annual Report Download - page 44
Download and view the complete annual report
Please find page 44 of the 2015 Seagate annual report below. You can navigate through the pages in the report by either clicking on the pages listed below, or by using the keyword search tool below to find specific information within the annual report.-
 1
1 -
2
-
3
-
4
-
5
-
6
-
7
-
8
-
9
-
10
-
11
-
12
-
13
-
14
-
15
-
16
-
17
-
18
-
19
-
20
-
21
-
22
-
23
-
24
-
25
-
26
-
27
-
28
-
29
-
30
-
31
-
32
-
33
-
 34
34 -
 35
35 -
 36
36 -
 37
37 -
 38
38 -
 39
39 -
 40
40 -
 41
41 -
 42
42 -
 43
43 -
 44
44 -
 45
45 -
 46
46 -
 47
47 -
 48
48 -
 49
49 -
 50
50 -
 51
51 -
 52
52 -
 53
53 -
 54
54 -
55
-
56
-
57
-
58
-
59
-
60
-
61
-
62
-
63
-
64
-
65
-
66
-
67
-
68
-
69
-
70
-
71
-
72
-
73
-
74
-
75
-
76
-
77
-
78
-
79
-
80
-
81
-
82
-
83
-
84
-
85
-
86
-
87
-
88
-
89
-
90
-
91
-
92
-
93
-
94
-
95
-
96
-
97
-
98
-
99
-
100
-
101
-
102
-
103
-
104
-
105
-
106
-
107
-
108
-
109
-
110
-
111
-
112
-
113
-
114
-
115
-
116
-
117
-
118
-
119
-
120
-
121
-
122
-
123
-
124
-
125
-
126
-
127
-
128
-
129
-
130
-
131
-
132
-
133
-
134
-
135
-
136
-
137
-
138
-
139
-
140
-
141
-
142
-
143
-
144
-
145
-
146
-
147
-
148
-
149
-
150
-
151
-
152
-
153
-
154
-
155
 |
 |
TableofContents
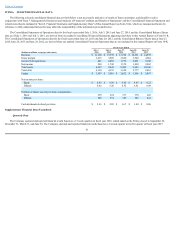
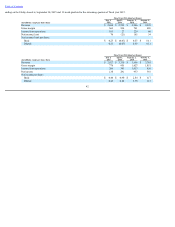
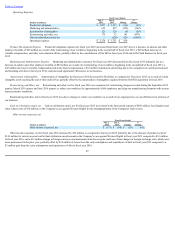
ITEM6.SELECTEDFINANCIALDATA
Thefollowingselectedconsolidatedfinancialdatasetforthbelowisnotnecessarilyindicativeofresultsoffutureoperations,andshouldbereadin
conjunctionwith"Item7.Management'sDiscussionandAnalysisofFinancialConditionandResultsofOperations"andtheConsolidatedFinancialStatementsand
relatednotestheretoincludedin"Item8.FinancialStatementsandSupplementaryData"ofthisAnnualReportonForm10-K,whichareincorporatedhereinby
reference,tofullyunderstandfactorsthatmayaffectthecomparabilityoftheinformationpresentedbelow.
TheConsolidatedStatementsofOperationsdataforthefiscalyearsendedJuly1,2016,July3,2015andJune27,2014,andtheConsolidatedBalanceSheets
dataasofJuly1,2016andJuly3,2015,arederivedfromourauditedConsolidatedFinancialStatementsappearingelsewhereinthisAnnualReportonForm10-K.
TheConsolidatedStatementsofOperationsdataforthefiscalyearsendedJune28,2013andJune29,2012,andtheConsolidatedBalanceSheetsdataatJune27,
2014,June28,2013andJune29,2012,arederivedfromourauditedConsolidatedFinancialStatementsthatarenotincludedinthisAnnualReportonForm10-K.
SupplementaryFinancialData(Unaudited)
QuarterlyData
TheCompanyoperatedandreportedfinancialresultsbasedona13-weekquartersinfiscalyear2016,whichendedontheFridayclosesttoSeptember30,
December31,March31,andJune30.TheCompanyoperatedandreportedfinancialresultsbasedona14-weekquarterinitsfirstquarteroffiscalyear2015
41
FiscalYearsEnded
(Dollarsinmillions,exceptpersharedata)
July1,
2016
July3,
2015
June27,
2014
June28,
2013
June29,
2012
Revenue $ 11,160 $ 13,739 $ 13,724 $ 14,351 $ 14,939
Grossmargin 2,615 3,809 3,846 3,940 4,684
Incomefromoperations 445 2,058 1,776 2,091 3,108
Netincome 248 1,742 1,570 1,838 2,862
Totalassets 8,252 9,845 9,492 9,243 10,106
Totaldebt 4,130 4,155 3,920 2,777 2,863
Equity $ 1,593 $ 3,018 $ 2,832 $ 3,506 $ 3,497
Netincomepershare:
Basic $ 0.83 $ 5.38 $ 4.66 $ 4.97 $ 6.72
Diluted 0.82 5.26 4.52 4.81 6.49
Numberofsharesusedinpersharecomputations:
Basic 299 324 337 370 426
Diluted 302 331 347 382 441
Cashdividendsdeclaredpershare $ 2.43 $ 2.05 $ 1.67 $ 1.40 $ 0.86