Seagate 2015 Annual Report Download - page 106
Download and view the complete annual report
Please find page 106 of the 2015 Seagate annual report below. You can navigate through the pages in the report by either clicking on the pages listed below, or by using the keyword search tool below to find specific information within the annual report.-
 1
1 -
2
-
3
-
4
-
5
-
6
-
7
-
8
-
9
-
10
-
11
-
12
-
13
-
14
-
15
-
16
-
17
-
18
-
19
-
20
-
21
-
22
-
23
-
24
-
25
-
26
-
27
-
28
-
29
-
30
-
31
-
32
-
33
-
34
-
35
-
36
-
37
-
38
-
39
-
40
-
41
-
42
-
43
-
44
-
45
-
46
-
47
-
48
-
49
-
50
-
51
-
52
-
53
-
54
-
55
-
56
-
57
-
58
-
59
-
60
-
61
-
62
-
63
-
64
-
65
-
66
-
67
-
68
-
69
-
70
-
71
-
72
-
73
-
74
-
75
-
76
-
77
-
78
-
79
-
80
-
81
-
82
-
83
-
84
-
85
-
86
-
87
-
88
-
89
-
90
-
91
-
92
-
93
-
94
-
95
-
 96
96 -
 97
97 -
 98
98 -
 99
99 -
 100
100 -
 101
101 -
 102
102 -
 103
103 -
 104
104 -
 105
105 -
 106
106 -
 107
107 -
 108
108 -
 109
109 -
 110
110 -
 111
111 -
 112
112 -
 113
113 -
 114
114 -
 115
115 -
 116
116 -
117
-
118
-
119
-
120
-
121
-
122
-
123
-
124
-
125
-
126
-
127
-
128
-
129
-
130
-
131
-
132
-
133
-
134
-
135
-
136
-
137
-
138
-
139
-
140
-
141
-
142
-
143
-
144
-
145
-
146
-
147
-
148
-
149
-
150
-
151
-
152
-
153
-
154
-
155
 |
 |
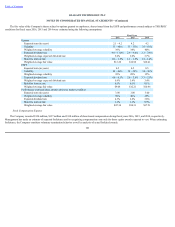
TableofContents
SEAGATETECHNOLOGYPLC
NOTESTOCONSOLIDATEDFINANCIALSTATEMENTS—(Continued)
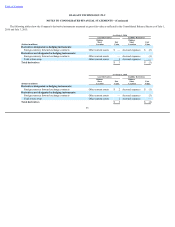
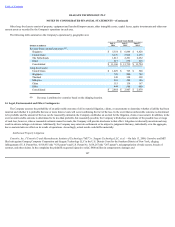
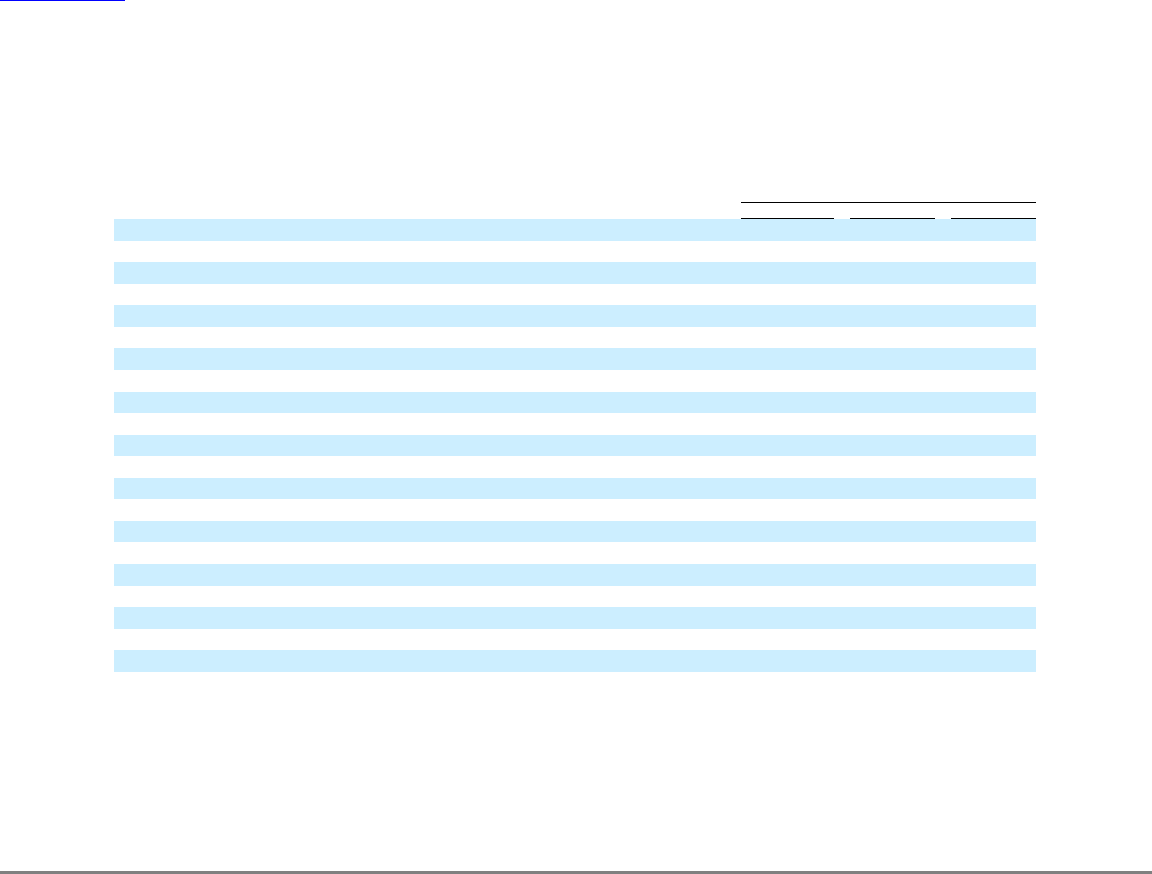
ThefairvalueoftheCompany'ssharesrelatedtooptionsgrantedtoemployees,sharesissuedfromtheESPPandperformanceawardssubjecttoTSR/ROIC
conditionsforfiscalyears2016,2015and2014wereestimatedusingthefollowingassumptions:
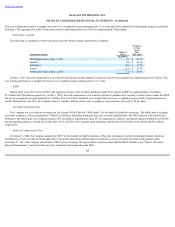
StockCompensationExpense
TheCompanyrecorded$120million,$137millionand$118millionofshare-basedcompensationduringfiscalyears2016,2015,and2014,respectively.
Managementhasmadeanestimateofexpectedforfeituresandisrecognizingcompensationcostsonlyforthoseequityawardsexpectedtovest.Whenestimating
forfeitures,theCompanyconsidersvoluntaryterminationbehavioraswellasanalysisofactualforfeitedawards.
103
FiscalYears
2016 2015 2014
Options
Expectedterm(inyears) 2.1–4.2 4.2 4.2
Volatility 33–48% 33–35% 35–41%
Weighted-averagevolatility 36% 34% 40%
Expecteddividendrate 4.6–11.0% 2.9–4.0% 3.1–3.8%
Weighted-averageexpecteddividendrate 5.6% 3.0% 3.7%
Risk-freeinterestrate 0.6–1.5% 1.1–1.5% 1.2–1.4%
Weighted-averagefairvalue $12.28 $12.98 $10.41
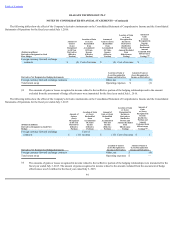
ESPP
Expectedterm(inyears) 0.5 0.5 0.5
Volatility 28–46% 28–29% 34–36%
Weighted-averagevolatility 39% 28% 35%
Expecteddividendrate 4.6–8.3% 3.0–3.8% 3.3–3.5%
Weighted-averageexpecteddividendrate 6.9% 3.4% 3.4%
Risk-freeinterestrate 0.5% 0.1% 0.1%
Weighted-averagefairvalue $9.08 $12.21 $10.46
Performancerestrictedshareawardssubjecttomarketcondition
Expectedterm(inyears) 3.00 3.00 3.00
Weighted-averagevolatility 30% 40% 46%
Expecteddividendrate 4.3% 2.8% 3.8%
Risk-freeinterestrate 1.1% 1.1% 0.9%
Weighted-averagefairvalue $47.34 $58.31 $37.51