Seagate 2015 Annual Report Download - page 45
Download and view the complete annual report
Please find page 45 of the 2015 Seagate annual report below. You can navigate through the pages in the report by either clicking on the pages listed below, or by using the keyword search tool below to find specific information within the annual report.-
 1
1 -
2
-
3
-
4
-
5
-
6
-
7
-
8
-
9
-
10
-
11
-
12
-
13
-
14
-
15
-
16
-
17
-
18
-
19
-
20
-
21
-
22
-
23
-
24
-
25
-
26
-
27
-
28
-
29
-
30
-
31
-
32
-
33
-
34
-
 35
35 -
 36
36 -
 37
37 -
 38
38 -
 39
39 -
 40
40 -
 41
41 -
 42
42 -
 43
43 -
 44
44 -
 45
45 -
 46
46 -
 47
47 -
 48
48 -
 49
49 -
 50
50 -
 51
51 -
 52
52 -
 53
53 -
 54
54 -
 55
55 -
56
-
57
-
58
-
59
-
60
-
61
-
62
-
63
-
64
-
65
-
66
-
67
-
68
-
69
-
70
-
71
-
72
-
73
-
74
-
75
-
76
-
77
-
78
-
79
-
80
-
81
-
82
-
83
-
84
-
85
-
86
-
87
-
88
-
89
-
90
-
91
-
92
-
93
-
94
-
95
-
96
-
97
-
98
-
99
-
100
-
101
-
102
-
103
-
104
-
105
-
106
-
107
-
108
-
109
-
110
-
111
-
112
-
113
-
114
-
115
-
116
-
117
-
118
-
119
-
120
-
121
-
122
-
123
-
124
-
125
-
126
-
127
-
128
-
129
-
130
-
131
-
132
-
133
-
134
-
135
-
136
-
137
-
138
-
139
-
140
-
141
-
142
-
143
-
144
-
145
-
146
-
147
-
148
-
149
-
150
-
151
-
152
-
153
-
154
-
155
 |
 |

TableofContents
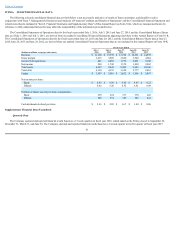
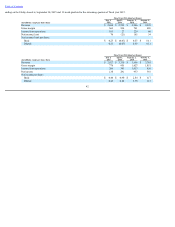
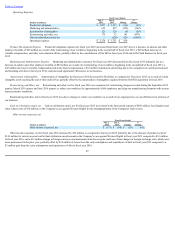
endingontheFridayclosesttoSeptember30,2015and13-weekquartersfortheremainingquartersoffiscalyear2015.
42
FiscalYear2016QuartersEnded
(Inmillions,exceptpersharedata)
July1,
2016
April1,
2016
January1,
2016
October2,
2015
Revenue $ 2,654 $ 2,595 $ 2,986 $ 2,925
Grossmargin 662 524 741 689
Incomefromoperations 103 27 229 86
Netincome(loss) 70 (21) 165 34
Netincome(loss)pershare:
Basic $ 0.23 $ (0.07) $ 0.55 $ 0.11
Diluted 0.23 (0.07) 0.55 0.11
FiscalYear2015QuartersEnded
(Inmillions,exceptpersharedata)
July3,
2015
April3,
2015
January2,
2015
October3,
2014
Revenue $ 2,927 $ 3,330 $ 3,696 $ 3,785
Grossmargin 776 955 1,027 1,051
Incomefromoperations 206 343 1,053 456
Netincome 138 291 933 381
Netincomepershare:
Basic $ 0.44 $ 0.90 $ 2.84 $ 1.17
Diluted 0.43 0.88 2.78 1.13