Seagate 2015 Annual Report Download - page 42
Download and view the complete annual report
Please find page 42 of the 2015 Seagate annual report below. You can navigate through the pages in the report by either clicking on the pages listed below, or by using the keyword search tool below to find specific information within the annual report.-
 1
1 -
2
-
3
-
4
-
5
-
6
-
7
-
8
-
9
-
10
-
11
-
12
-
13
-
14
-
15
-
16
-
17
-
18
-
19
-
20
-
21
-
22
-
23
-
24
-
25
-
26
-
27
-
28
-
29
-
30
-
31
-
 32
32 -
 33
33 -
 34
34 -
 35
35 -
 36
36 -
 37
37 -
 38
38 -
 39
39 -
 40
40 -
 41
41 -
 42
42 -
 43
43 -
 44
44 -
 45
45 -
 46
46 -
 47
47 -
 48
48 -
 49
49 -
 50
50 -
 51
51 -
 52
52 -
53
-
54
-
55
-
56
-
57
-
58
-
59
-
60
-
61
-
62
-
63
-
64
-
65
-
66
-
67
-
68
-
69
-
70
-
71
-
72
-
73
-
74
-
75
-
76
-
77
-
78
-
79
-
80
-
81
-
82
-
83
-
84
-
85
-
86
-
87
-
88
-
89
-
90
-
91
-
92
-
93
-
94
-
95
-
96
-
97
-
98
-
99
-
100
-
101
-
102
-
103
-
104
-
105
-
106
-
107
-
108
-
109
-
110
-
111
-
112
-
113
-
114
-
115
-
116
-
117
-
118
-
119
-
120
-
121
-
122
-
123
-
124
-
125
-
126
-
127
-
128
-
129
-
130
-
131
-
132
-
133
-
134
-
135
-
136
-
137
-
138
-
139
-
140
-
141
-
142
-
143
-
144
-
145
-
146
-
147
-
148
-
149
-
150
-
151
-
152
-
153
-
154
-
155
 |
 |

TableofContents
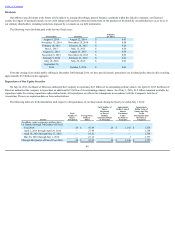
PerformanceGraph
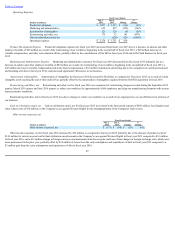
TheperformancegraphbelowshowsthecumulativetotalshareholderreturnonourordinarysharesfortheperiodfromJuly1,2011toJuly1,2016.Thisis
comparedwiththecumulativetotalreturnoftheDowJonesUSComputerHardwareIndexandtheStandard&Poor's500StockIndexoverthesameperiod.The
graphassumesthatonJuly1,2011,$100wasinvestedinourordinarysharesand$100wasinvestedineachoftheothertwoindices,withdividendsreinvestedon
thedateofpaymentwithoutpaymentofanycommissions.Dollaramountsinthegraphareroundedtothenearestwholedollar.Theperformanceshowninthe
graphrepresentspastperformanceandshouldnotbeconsideredanindicationoffutureperformance.
Copyright©2,016BloombergFinanceL.P.Allrightsreserved.
39
7/1/2011 6/29/2012 6/28/2013 6/27/2014 7/3/2015 7/1/2016
SeagateTechnologyplc 100.00 157.75 298.61 392.94 344.01 185.84
S&P500 100.00 103.93 125.32 156.19 168.87 174.77
DowJonesUSComputerHardware 100.00 131.29 102.88 155.52 190.99 152.43
*$100investedon7/1/11instockandinindices,includingreinvestmentofdividends.