Ricoh 2014 Annual Report Download - page 7
Download and view the complete annual report
Please find page 7 of the 2014 Ricoh annual report below. You can navigate through the pages in the report by either clicking on the pages listed below, or by using the keyword search tool below to find specific information within the annual report.-
 1
1 -
 2
2 -
 3
3 -
 4
4 -
 5
5 -
 6
6 -
 7
7 -
 8
8 -
 9
9 -
 10
10 -
 11
11 -
 12
12 -
 13
13 -
 14
14 -
 15
15 -
 16
16 -
 17
17 -
 18
18 -
19
-
20
-
21
-
22
-
23
-
24
-
25
-
26
-
27
-
28
-
29
-
30
-
31
-
32
-
33
-
34
-
35
-
36
-
37
-
38
-
39
-
40
-
41
-
42
-
43
-
44
-
45
-
46
-
47
-
48
-
49
-
50
-
51
-
52
-
53
-
54
-
55
-
56
-
57
-
58
-
59
-
60
-
61
-
62
-
63
-
64
-
65
-
66
-
67
-
68
-
69
-
70
-
71
-
72
-
73
-
74
-
75
-
76
-
77
-
78
-
79
-
80
-
81
-
82
-
83
-
84
-
85
-
86
-
87
-
88
-
89
-
90
-
91
-
92
-
93
-
94
-
95
-
96
-
97
-
98
-
99
-
100
-
101
-
102
-
103
-
104
-
105
-
106
 |
 |

Overview Action Data & Prole
About the Ricoh Group
Ricoh Group Sustainability Report 2014 6
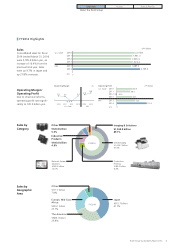
Sales
Consolidated sales for fiscal
2014 (ended March 31, 2014)
were 2,195.6 billion yen, an
increase of 16.4% from the
previous fiscal year. Sales
wereup9.7%inJapanand
up 21.8% overseas.
(JPY billion)
0
1,903.4
1,924.4
2013
2010
U.S. GAAP
IFRS
2,015.8
2011
1,885.9
2,195.6
2013
2014
1,941.3
2012
(FY)
FY2014
Sales by
Category
FY2014
Operating Margin/
Operating Profit
Due to structural reforms,
operating profit rose signifi-
cantly to 120.3 billion yen.
(%)
2010 2013 2013 2014
IFRSU.S. GAAP
3.3
2011
3.0
−0.9
2012
3.3 3.9 5.5
0
(FY) 0
2013
2014
2010 65.9
2011 58.0
63.4
2012 –18.0
2013
73.5
120.3
IFRS
U.S. GAAP
(JPY billion)
Operating Margin Operating Prot
Sales by
Geographic
Area
Europe, Mid-East,
Africa
¥519.1 billion
23.7%
Other
¥171.7billion
7.8%
Japan
¥915.7billion
41.7%
The Americas
¥589.1 billion
26.8%
Industrial
Products
¥105.0 billion
4.8%
Network System
Solutions
¥308.0 billion
14.0%
Imaging & Solutions
¥1,969.8 billion
89.7%
Ofce Imaging
¥1,476.7billion
67.3%
Production
Printing
¥185.0 billion
8.4%
Other
¥120.8 billion
5.5%
FY2014 Highlights