Qantas 2004 Annual Report Download - page 64
Download and view the complete annual report
Please find page 64 of the 2004 Qantas annual report below. You can navigate through the pages in the report by either clicking on the pages listed below, or by using the keyword search tool below to find specific information within the annual report.-
 1
1 -
2
-
3
-
4
-
5
-
6
-
7
-
8
-
9
-
10
-
11
-
12
-
13
-
14
-
15
-
16
-
17
-
18
-
19
-
20
-
21
-
22
-
23
-
24
-
25
-
26
-
27
-
28
-
29
-
30
-
31
-
32
-
33
-
34
-
35
-
36
-
37
-
38
-
39
-
40
-
41
-
42
-
43
-
44
-
45
-
46
-
47
-
48
-
49
-
50
-
51
-
52
-
53
-
 54
54 -
 55
55 -
 56
56 -
 57
57 -
 58
58 -
 59
59 -
 60
60 -
 61
61 -
 62
62 -
 63
63 -
 64
64 -
 65
65 -
 66
66 -
 67
67 -
 68
68 -
 69
69 -
 70
70 -
 71
71 -
 72
72 -
 73
73 -
 74
74 -
75
-
76
-
77
-
78
-
79
-
80
-
81
-
82
-
83
-
84
-
85
-
86
-
87
-
88
 |
 |

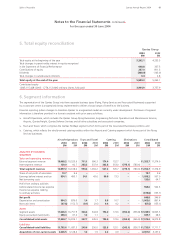
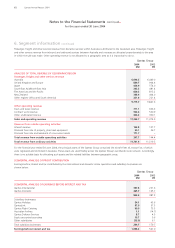
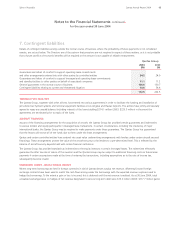
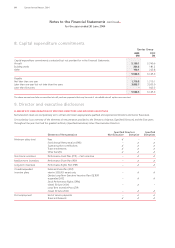
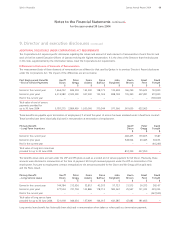
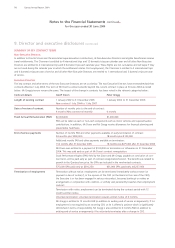
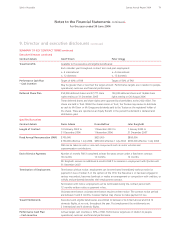
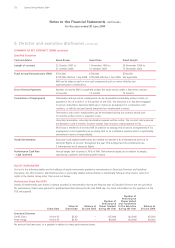
Notes to the Financial Statements continued
for the year ended 30 June 2004
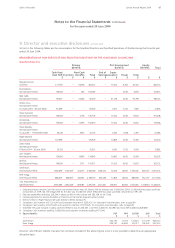
6. Segment information continued
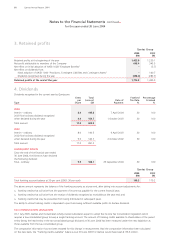
Passenger, freight and other services revenue from domestic services within Australia is attributed to the Australian area. Passenger, freight
and other services revenue from inbound and outbound services between Australia and overseas are allocated proportionately to the area
in which the sale was made. Other operating revenue is not allocated to a geographic area as it is impractical to do so.
Qantas Group
2004 2003
$M $M
ANALYSIS OF TOTAL REVENUE BY GEOGRAPHIC REGION
Passenger, freight and other services revenue
Australia 6,696.5 6,449.0
United Kingdom and Europe 839.7 904.6
Japan 426.9 574.0
South-East Asia/North-East Asia 342.3 481.4
The Americas and the Pacific 820.3 813.2
New Zealand 368.4 404.0
Other regions (Africa and South America) 221.6 221.4
9,715.7 9,847.6
Other operating revenue
Tours and travel revenue 711.1 696.3
Contract work revenue 502.6 530.9
Other unallocated revenue 424.3 300.1
Sales and operating revenue 11,353.7 11,374.9
Revenue from outside operating activities
Interest revenue 125.9 107.7
Proceeds from sale of property, plant and equipment 50.1 36.7
Proceeds from sale and leaseback of non-current assets 171.7 –
Total revenue from outside operating activities 347.7 144.4
Total revenue from ordinary activities 11,701.4 11,519.3
For the financial year ended 30 June 2004, the principal assets of the Qantas Group comprised the aircraft fleet all, except five, of which
were registered and domiciled in Australia. These assets are used flexibly across the Qantas Group’s worldwide route network. Accordingly,
there is no suitable basis for allocating such assets and the related liabilities between geographic areas.
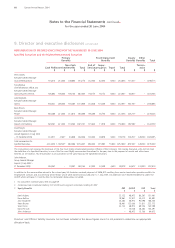
SEGMENTAL ANALYSIS OF PROFIT CONTRIBUTION
Earnings before interest and tax contributed by the international and domestic airline operations and subsidiary businesses are
shown below:
Qantas Group
2004 2003
$M $M
SEGMENTAL ANALYSIS OF EARNINGS BEFORE INTEREST AND TAX
Qantas International 397.8 221.6
Qantas Domestic 465.7 165.7
863.5 387.3
Subsidiary businesses
Qantas Holidays 54.1 43.6
QantasLink 97.0 57.3
Qantas Flight Catering 90.0 73.3
Australian Airlines 1.1 (14.7)
Qantas Defence Services 8.7 4.5
Equity accounted associates 19.7 9.6
Other subsidiaries (35.9) 6.1
Total subsidiary businesses 234.7 179.7
Earnings before interest and tax 1,098.2 567.0
62 Qantas Annual Report 2004