Qantas 2004 Annual Report Download - page 56
Download and view the complete annual report
Please find page 56 of the 2004 Qantas annual report below. You can navigate through the pages in the report by either clicking on the pages listed below, or by using the keyword search tool below to find specific information within the annual report.-
 1
1 -
2
-
3
-
4
-
5
-
6
-
7
-
8
-
9
-
10
-
11
-
12
-
13
-
14
-
15
-
16
-
17
-
18
-
19
-
20
-
21
-
22
-
23
-
24
-
25
-
26
-
27
-
28
-
29
-
30
-
31
-
32
-
33
-
34
-
35
-
36
-
37
-
38
-
39
-
40
-
41
-
42
-
43
-
44
-
45
-
 46
46 -
 47
47 -
 48
48 -
 49
49 -
 50
50 -
 51
51 -
 52
52 -
 53
53 -
 54
54 -
 55
55 -
 56
56 -
 57
57 -
 58
58 -
 59
59 -
 60
60 -
 61
61 -
 62
62 -
 63
63 -
 64
64 -
 65
65 -
 66
66 -
67
-
68
-
69
-
70
-
71
-
72
-
73
-
74
-
75
-
76
-
77
-
78
-
79
-
80
-
81
-
82
-
83
-
84
-
85
-
86
-
87
-
88
 |
 |

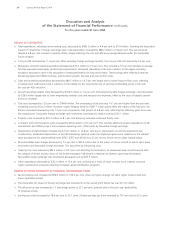
Discussion and Analysis
of the Statement of Financial Performance continued
for the year ended 30 June 2004
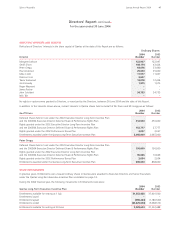
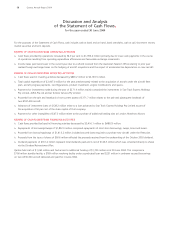
REVIEW OF EXPENDITURE
Total expenditure, including net borrowing costs, decreased by $483.5 million or 4.4 per cent to $10.4 billion. Excluding the favourable
impact of movements in foreign exchange rates, total expenditure increased by $88.2 million or 0.8 per cent. This was achieved
despite a 4.8 per cent increase in capacity (ASKs), largely reflecting the cost and efficiency savings delivered under the Sustainable
Future program.
Cost per ASK decreased by 11.4 per cent. After excluding foreign exchange benefits, the cost per ASK still reduced by 5.4 per cent.
Manpower and staff related expenditure decreased by $79.2 million or 2.6 per cent. This included a 2.9 per cent decrease in average
full-time equivalent employees, productivity improvements, decreased redundancy costs and a revision to the wages and salary
escalation assumption used in the calculation of employee benefits for long service leave. These savings were offset by Enterprise
Bargaining Agreement (EBA) increases, activity driven growth, bonuses and new uniform costs.
Sales and marketing expenditure decreased by $80.5 million or 14.7 per cent largely due to lower Frequent Flyer costs, reflecting
increased point redemptions and a reduction in the liability for the incremental cost of servicing outstanding points in line with
the cost per ASK reduction.
Aircraft operating variable costs decreased by $178.2 million or 7.4 per cent. Excluding favourable foreign exchange, costs decreased
by $28.0 million largely due to lower engineering material costs and reduced crew expenses, offset by the costs of capacity growth
and price increases.
Fuel costs decreased by 12.0 per cent or $184.8 million. The underlying jet fuel price was 14.1 per cent higher than the prior year,
increasing costs by $120.2 million. However, higher hedging benefits of $87.7 million partly offset the impact of the fuel price rise.
Barrels consumed increased by only 1.3 per cent compared to ASK growth of 4.8 per cent, reflecting fuel efficiency gains from new
fleet acquisitions. Favourable foreign exchange rate movements contributed to reduce costs by $235.1 million.
Property costs increased by $23.3 million or 8.1 per cent driven by increased rental and facility costs.
Computer and communication costs increased by $26.8 million or 6.5 per cent. This includes additional project expenditure on eQ
and Jetsmart (an ETOMS project) and increased operating costs, offset partly by favourable foreign exchange.
Depreciation and amortisation increased by $114.2 million or 12.8 per cent due to depreciation on aircraft acquisitions and
modifications, accelerated depreciation of aircraft seats being replaced under the Skybed program and a reduction in the residual
value assumptions for wide-bodied aircraft (B747, B767 and A330) from 25 per cent to 20 per cent to align residual values.
Non-cancellable lease charges decreased by 7.2 per cent or $20.4 million due to the return of various aircraft to lessors upon lease
termination and favourable foreign exchange. This was offset by refinancing costs.
Capacity hire costs reduced by $94.2 million or 24.7 per cent reflecting the termination of several wet-lease aircraft sourced after
the collapse of Ansett and the return of five British Aerospace 146 aircraft to National Jet Systems upon lease termination.
Favourable foreign exchange rate movements decreased costs by $23.5 million.
Other expenditure decreased by $76.2 million or 15.6 per cent, primarily as a result of lower contract work material costs and
higher maintenance recoveries reflecting increased capital modification programs.
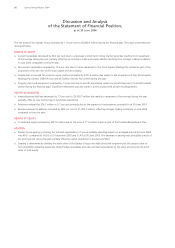
REVIEW OF OTHER STATEMENT OF FINANCIAL PERFORMANCE ITEMS
Net borrowing costs increased by $68.9 million or 106.5 per cent, driven by higher average net debt, higher interest costs and
lower capitalised interest.
The favourable net impact of foreign exchange rate movements on the overall profit before tax was $115.0 million.
The effective tax rate increased by 1.7 percentage points to 32.7 per cent, primarily due to the prior year deductibility
of employee shares.
Earnings per share increased by 78.6 per cent to 35.7 cents. Diluted earnings per share increased by 79.3 per cent to 35.5 cents.
54 Qantas Annual Report 2004