Porsche 2015 Annual Report Download - page 135
Download and view the complete annual report
Please find page 135 of the 2015 Porsche annual report below. You can navigate through the pages in the report by either clicking on the pages listed below, or by using the keyword search tool below to find specific information within the annual report.-
 1
1 -
2
-
3
-
4
-
5
-
6
-
7
-
8
-
9
-
10
-
11
-
12
-
13
-
14
-
15
-
16
-
17
-
18
-
19
-
20
-
21
-
22
-
23
-
24
-
25
-
26
-
27
-
28
-
29
-
30
-
31
-
32
-
33
-
34
-
35
-
36
-
37
-
38
-
39
-
40
-
41
-
42
-
43
-
44
-
45
-
46
-
47
-
48
-
49
-
50
-
51
-
52
-
53
-
54
-
55
-
56
-
57
-
58
-
59
-
60
-
61
-
62
-
63
-
64
-
65
-
66
-
67
-
68
-
69
-
70
-
71
-
72
-
73
-
74
-
75
-
76
-
77
-
78
-
79
-
80
-
81
-
82
-
83
-
84
-
85
-
86
-
87
-
88
-
89
-
90
-
91
-
92
-
93
-
94
-
95
-
96
-
97
-
98
-
99
-
100
-
101
-
102
-
103
-
104
-
105
-
106
-
107
-
108
-
109
-
110
-
111
-
112
-
113
-
114
-
115
-
116
-
117
-
118
-
119
-
120
-
121
-
122
-
123
-
124
-
 125
125 -
 126
126 -
 127
127 -
 128
128 -
 129
129 -
 130
130 -
 131
131 -
 132
132 -
 133
133 -
 134
134 -
 135
135 -
 136
136 -
 137
137 -
 138
138 -
 139
139 -
 140
140 -
 141
141 -
 142
142 -
 143
143 -
 144
144 -
 145
145 -
146
-
147
-
148
 |
 |

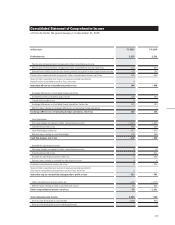
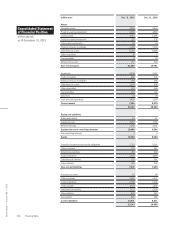
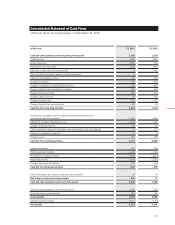
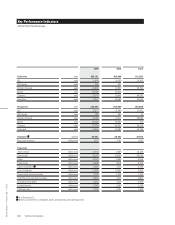
Consolidated Statement of Cash Flows
of Porsche AG for the period January 1 to December 31, 2015
million euro FY 2015 FY 2014
Cash and cash equivalents at the beginning of the period 1,560 1,570
Prot before tax 3,382 3,060
Income taxes paid – 1,148 – 784
Depreciation and amortization 2,124 1,878
Gain / loss on disposal of non-current assets 5– 281
Share of prots and losses of equity-accounted investments 3 1
Other non-cash expense / income 312 254
Change in inventories – 220 – 460
Change in receivables (excluding nancial services) – 542 – 586
Change in liabilities (excluding nancial liabilities) 602 608
Change in pension provisions 208 164
Change in other provisions 63 195
Change in leased assets – 827 – 775
Change in nancial services receivables – 119 – 95
Cash ow from operating activities 3,843 3,179
Investments in intangible assets (excluding capitalised development costs),
and property, plant and equipment – 1,388 – 1,047
Additions to capitalised development costs – 1,039 – 1,067
Change in equity investments – 26 – 50
Cash received from disposal of intangible assets and property, plant and equipment 77 170
Change in investments in securities – 4 14
Change in loans 261 – 268
Cash ow from investing activities – 2,119 – 2,248
Capital contributions 707 829
Prot transfer and dividends – 1,232 – 1,414
Proceeds from issuance of bonds 2,536 2,473
Repayment of bonds – 2,343 – 2,228
Change in other nancial liabilities – 506 – 638
Cash ow from financing activities – 838 – 978
Eect of exchange rate changes on cash and cash equivalents 39 – 47
Net change in cash and cash equivalents 886 37
Cash and cash equivalents at the end of the period 2,485 1,560
Cash and cash equivalents at the end of the period 2,485 1,560
Securities, loans and time deposits 267 526
Gross liquidity 2,752 2,086
Total third-party borrowings – 5,317 – 5,353
Net liquidity – 2,566 – 3,267
131